Users & journeys
Data Engineer guide
This guide follows Anna Kowalska, the Data Engineer persona, through every journey she takes on DataFlow AI — from her first day on the platform to the steady rhythm of building, scheduling, and debugging the 500+ pipelines the DWH team runs. Every step is mapped to a concrete screen and route so you can follow along in the product.
Before you start
The Data Engineer is the platform's power user. Anna works across all three editing modes — Visual, SQL, and Python — and has the broadest set of permissions short of the admin. Her backend role is ENGINEER (level 75); her Keycloak realm role is developer; her UX persona is engineer.
Her allowed route prefixes include /, /design-studio, /monitor, /governance, /migration, /connections, /marketplace, /pipelines, /data-browser, and /templates. She can create, edit, run, deploy, debug, and delete pipelines, and manage connections.
Journey 1 — Five-day onboarding
The goal of onboarding is to take Anna from her first login to a productive production pipeline within five days.
Day 1 — Account setup
- Anna opens the platform URL. Because Active Directory federation is configured, her AD credentials auto-provision a DataFlow account at the Keycloak login screen.
- After authentication she lands on the workspace selector in the top bar and chooses her DWH workspace.
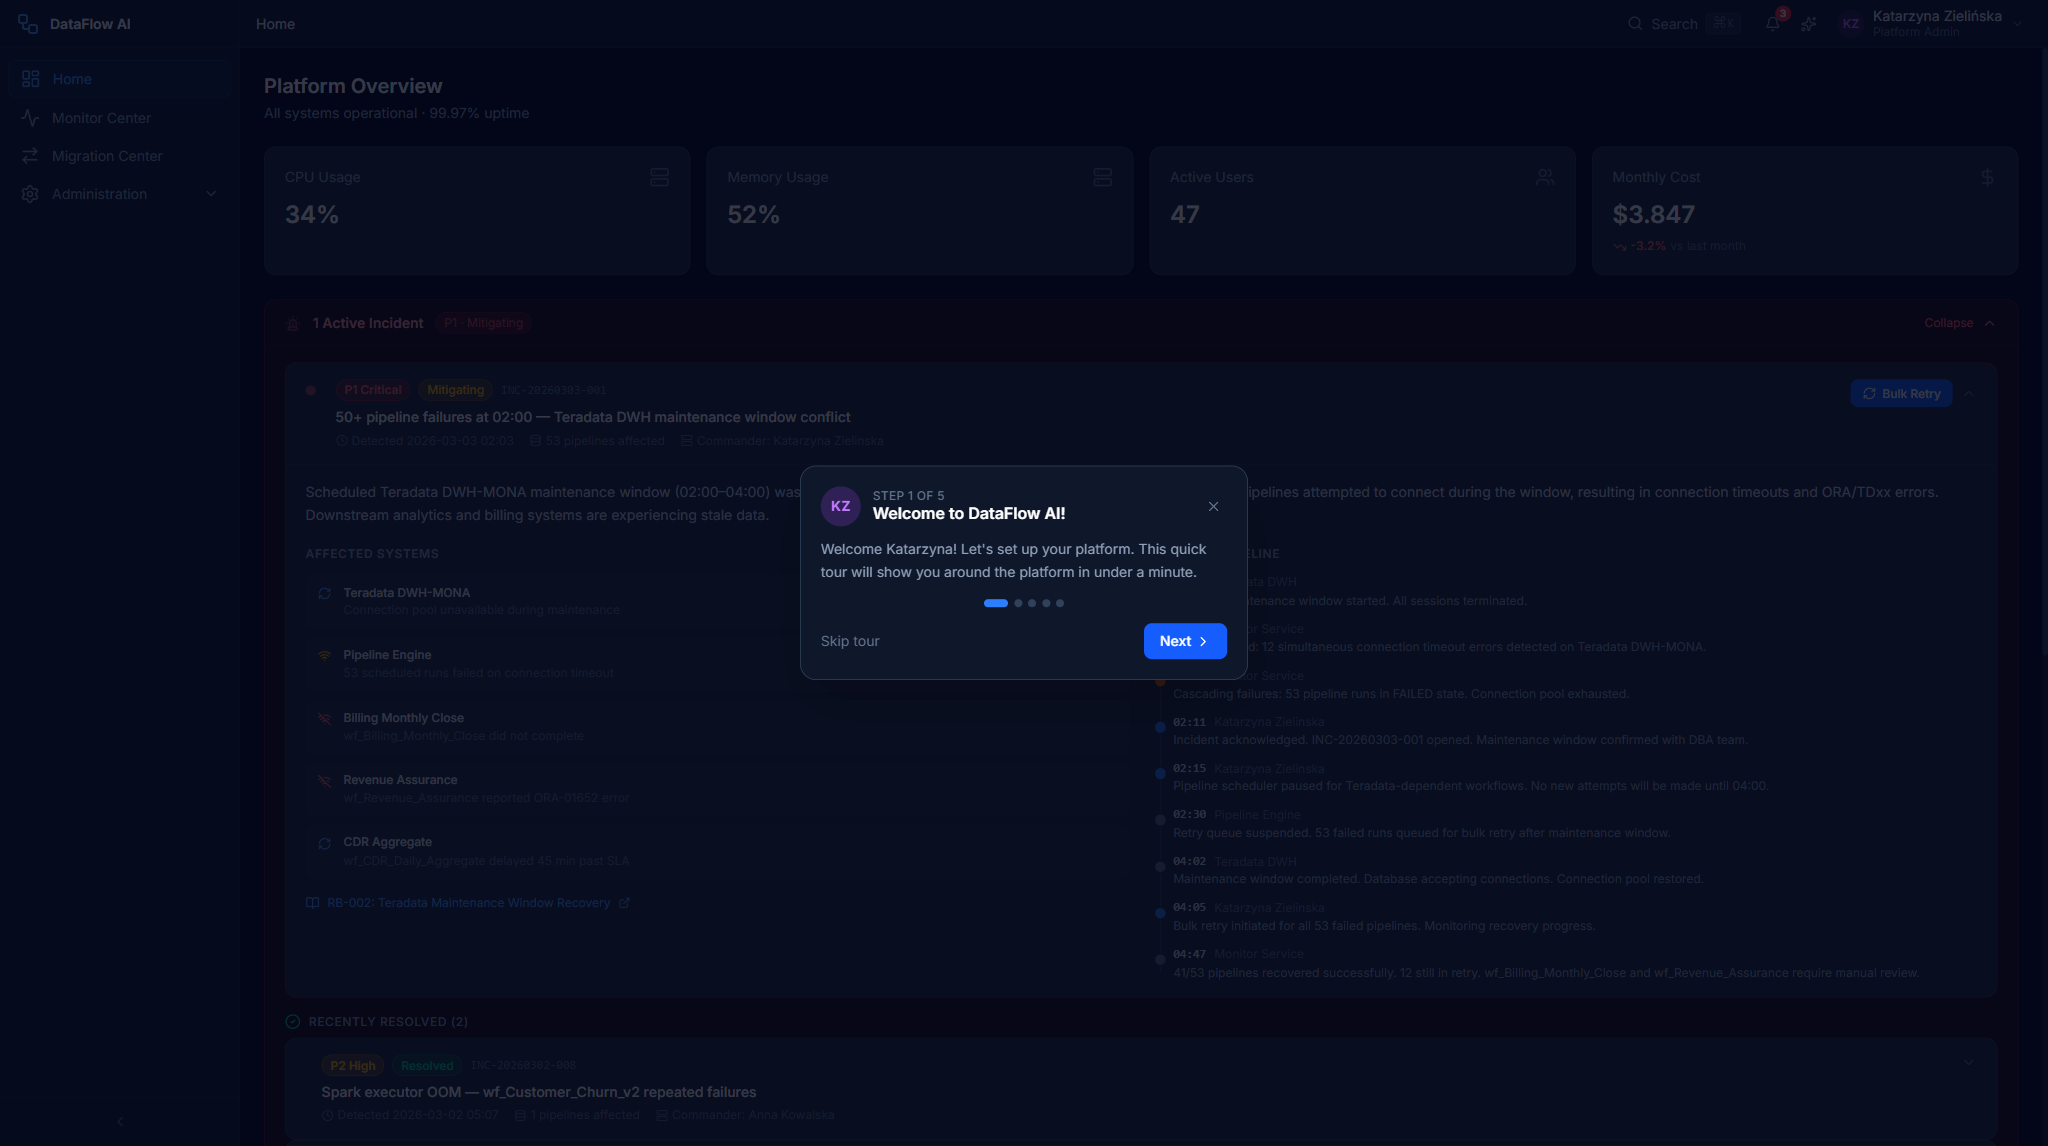
- An onboarding tour overlay walks her through the Design Studio — the canvas, the palette, and the editing modes.
- She clones a set of sample pipelines and runs a "Hello World" pipeline. It completes within 15 minutes.
Screens: Keycloak login, TopBar workspace selector, onboarding tour overlay, Design Studio.
Day 2–3 — Tools setup
- Anna connects her Git repository (GitLab or Stash) so every pipeline definition is versioned as YAML.
- She sets up her local IDE — VS Code with the Python SDK and the
dataflowCLI — and authenticates withdataflow login. - She registers connections to the databases she works with: Teradata, Snowflake, and Databricks.
- She runs a test pipeline and confirms the push-down SQL is correct.
Screens: Git integration, CLI, connection registration, Design Studio test run.
Day 4–5 — First real pipeline
- Anna opens the Migration Center and migrates a pipeline from PowerCenter.
- She customizes the converted YAML in the Design Studio YAML editor.
- She submits the pipeline for code review through a Git pull request.
- Once approved, she deploys to Dev.
Screens: Migration Center, Design Studio YAML editor, Git PR / code review, environment promotion.
| Onboarding metric | Target |
|---|---|
| Time to first pipeline run | < 2 hours |
| Time to first production pipeline | < 5 days |
| Onboarding satisfaction | > 4.5 / 5 |
Journey 2 — Daily workflow
A typical day for Anna moves from a morning health check, through fixing failures, into development, and ends with code review and deployment.
09:00 — Morning check
- Anna opens her role-adaptive Home Dashboard (
/dashboard, engineer variant). - She reads the
PipelineStatusCard— overnight, 487 of 500 pipelines are healthy, 2 failed, 11 are in warning. - She clicks a failed run in the
RecentFailuresCard, which navigates her to/monitor/runs/{runId}.
09:30 — Fix failures
- On the Run Detail page she reads the structured, color-coded error log with its full stack trace.
- The AI Diagnosis Panel diagnoses the issue — for example, "Teradata lock contention" — and suggests a fix such as "add retry with exponential backoff".
- Anna applies the fix and uses one-click re-run from checkpoint so the pipeline resumes rather than restarting from scratch.
10:00 — Pipeline development
- Anna opens the Design Studio and creates a new pipeline.
- She uses tri-mode editing — Visual, SQL, and Python all stay in sync, backed by one canonical YAML definition.
- At each node she views the inline data preview and profiling (column types, null percentage, value distribution) in the right-panel Preview tab.
14:00 — Code review and deploy
- Anna commits her work to Git, either from the UI
CommitModalor the CLI. - She opens a pull request that includes a visual pipeline diff so reviewers see the DAG change, not just YAML text.
- CI validates the change; once it is green and approved, she merges and promotes to staging.
Screens: HomeDashboard (engineer), PipelineStatusCard, RecentFailuresCard, Monitor Center Run Detail, AiDiagnosisPanel, Design Studio canvas and editors, NodePreviewTab, CommitModal, DeployModal.
Journey 3 — Build and schedule a pipeline
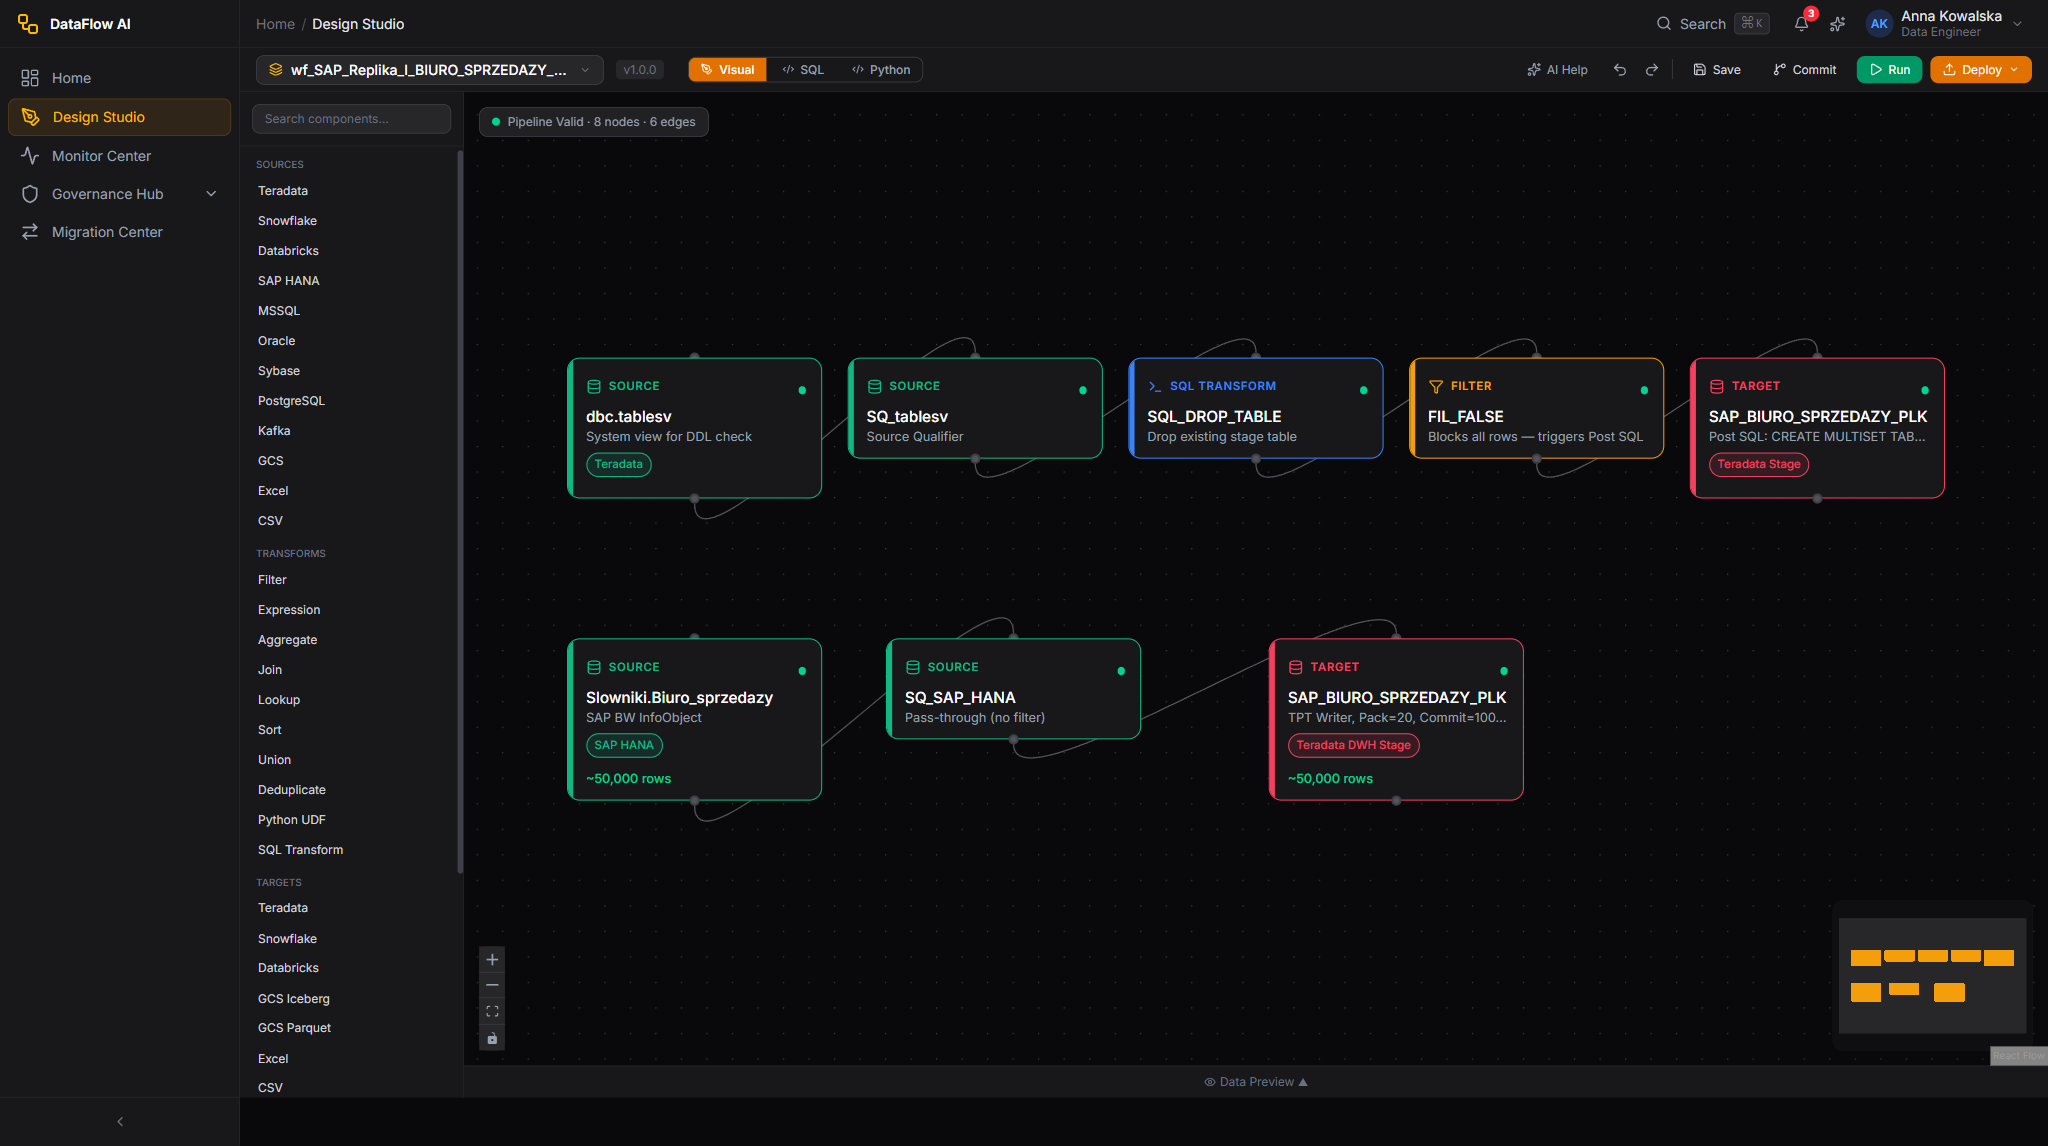
This is the core creative journey. Anna builds an ETL pipeline from scratch in the Design Studio and puts it on a schedule.
- New pipeline. In the Design Studio, Anna creates a new pipeline and gives it a name and a type — Batch or Streaming (a streaming pipeline runs on Kafka + Flink).
- Drag components. From the left-panel Component Palette she drags nodes onto the canvas. The palette has five categories — Sources (14 connectors), Transforms (12), Targets (14), Quality (5), and AI (3). She connects each node's output port to the next node's input port.
- Configure source and target. Selecting a node opens the right-side Properties Inspector. For a source she sets the connection, table or query, partition column, fetch size, and incremental column. For a target she additionally sets the write mode (Append / Overwrite / Upsert / Merge / Delete-Insert), upsert keys, and pre/post SQL.
- Add transformations. She drops in transforms — SQL, Filter, Aggregate, Join, Deduplicate, and so on — and wires them between source and target.
- Preview data. At any node she opens Data Preview to see up to 100 real rows pulled from the source with a
LIMIT. - Switch to YAML. Optionally she opens the YAML editor, which stays in bidirectional sync with the canvas and offers autocomplete and validation.
- Run or schedule. She clicks Run to execute manually, or Schedule to set a cron expression with a timezone, a business-day filter, and an overlap strategy.
- Monitor live. The run streams per-step status over WebSocket; she watches it live and reviews history on the Runs tab.
- Backfill. For historical dates she opens Backfill and sets a date range, granularity, concurrency, and an optional dry-run toggle.
Telecom templates
Anna does not always start from a blank canvas. Pipeline Templates (/templates) offers pre-built, telecom-specific templates such as "CDR Ingestion". Choosing Use Template opens the Design Studio at /design-studio?template={id} pre-populated.
Journey 4 — Debugging a failure
Walkthrough of a real incident: pipeline wf_E112 reported FAILED at 03:47.
Step 1 — Triage
- Anna receives a notification (PagerDuty, email, or Slack).
- She opens the pipeline's Run Detail page. The failed node is highlighted red on the visual DAG, with a red glow and an error-tooltip bubble.
Step 2 — Investigate
- She reads the structured error log and stack trace in the left panel.
- The AI Diagnosis Panel (right, 40% of the screen) gives a violet-gradient card with a Summary, a Root Cause — for example, "Sybase source timed out due to lock contention" — and numbered Suggested Actions such as "retry with read-uncommitted", each with a confidence percentage.
- She follows the lineage links to see which downstream systems are affected.
Step 3 — Fix and verify
- Anna applies the suggested fix in the pipeline YAML.
- She clicks Re-run from Checkpoint so the pipeline resumes from the failed step rather than starting over.
- She verifies data completeness in the target table.
Screens: notification panel, Monitor PipelineRunDetail + RunDagViewer + AiDiagnosisPanel, Lineage Explorer (impact), RunDetailActions.
Re-run from checkpoint vs. re-run
Re-run from Checkpoint is only available when a checkpoint exists for the run. It resumes from the failed node and is far cheaper than a full Re-run, which restarts the pipeline from the beginning. Always prefer the checkpoint option when it is offered.
Journey 5 — Building a custom connector
Engineers can extend the platform itself with new connectors and SQL dialects. This is a developer-facing journey.
Adding a connector
- Implement either
JDBCConnectorBaseorNativeConnectorBase, providing the required methods:connect,disconnect,testConnection,doDiscoverSchema,doExtractData, anddoLoadData. - Register the new connector in the
ConnectorRegistry. - Add a corresponding value to the
ConnectionTypeenum. - Write tests for the connector.
Adding a push-down SQL dialect
- Create a
SqlDialectclass for the new database. - Register it in
SparkSqlBridge.kt. - Write dialect tests.
Contribution workflow
| Step | Action |
|---|---|
| 1 | Create a feature branch |
| 2 | Ensure all tests pass |
| 3 | Run ktlint (Kotlin) and ruff (Python) |
| 4 | Open a pull request with at least one code-owner approval and green CI |
| 5 | Squash-merge to main |
Once merged, the new connector appears in the Connector Marketplace (/marketplace) and as a node in the Design Studio Component Palette.
Journey → screen cross-reference
| Journey | Entry route | Key screens / components |
|---|---|---|
| Onboarding | / → /dashboard | Keycloak login, workspace selector, onboarding tour, Design Studio, Git connect, CLI |
| Daily check & debug | /dashboard, /monitor | PipelineStatusCard, RecentFailuresCard, PipelineRunDetail, RunDagViewer, AiDiagnosisPanel |
| Build & schedule | /design-studio | Canvas, palette, SQL/Python/YAML editors, NodePreviewTab, schedule dialog, backfill |
| Code review & deploy | /design-studio | CommitModal, DeployModal, visual pipeline diff, environment promotion |
| Debugging | /monitor/runs/:id | PipelineRunDetail, RunDagViewer, AiDiagnosisPanel, RunDetailActions |
| Custom connector | (developer flow) | ConnectorRegistry, ConnectionType, SparkSqlBridge.kt |
Where to go next
- User journeys — the full journey index with ASCII maps.
- Analyst & Steward guide — the journeys for the personas Anna hands work off to.
- Administrator guide — platform operations and legacy migration.
- Personas & roles — how the Engineer persona maps to backend and Keycloak roles.