Feature guides
Admin Console
The Admin Console is the control plane of the DataFlow AI Platform — the single surface where Platform Admins manage users and roles, workspaces, data connections and credentials, security and SSO configuration, infrastructure health, cloud cost, and the platform-wide audit log.
Who uses the Admin Console
The Admin Console is the exclusive workspace of the Platform Admin persona (Katarzyna Zielińska). No other persona has access — the route guard restricts the /admin prefix to the admin persona, and the backend metadata-service UserController and WorkspaceController guard every method with hasRole('ADMIN').
A small exception: the Data Steward persona has scoped access to /admin/audit-log and /admin/access-reviews for governance oversight, but not to the full console.
Heads up
Admin Console actions are high-impact — deactivating a user, rotating an API key, or changing an RBAC role affects access immediately. Every mutating action is written to the audit log.
Module layout
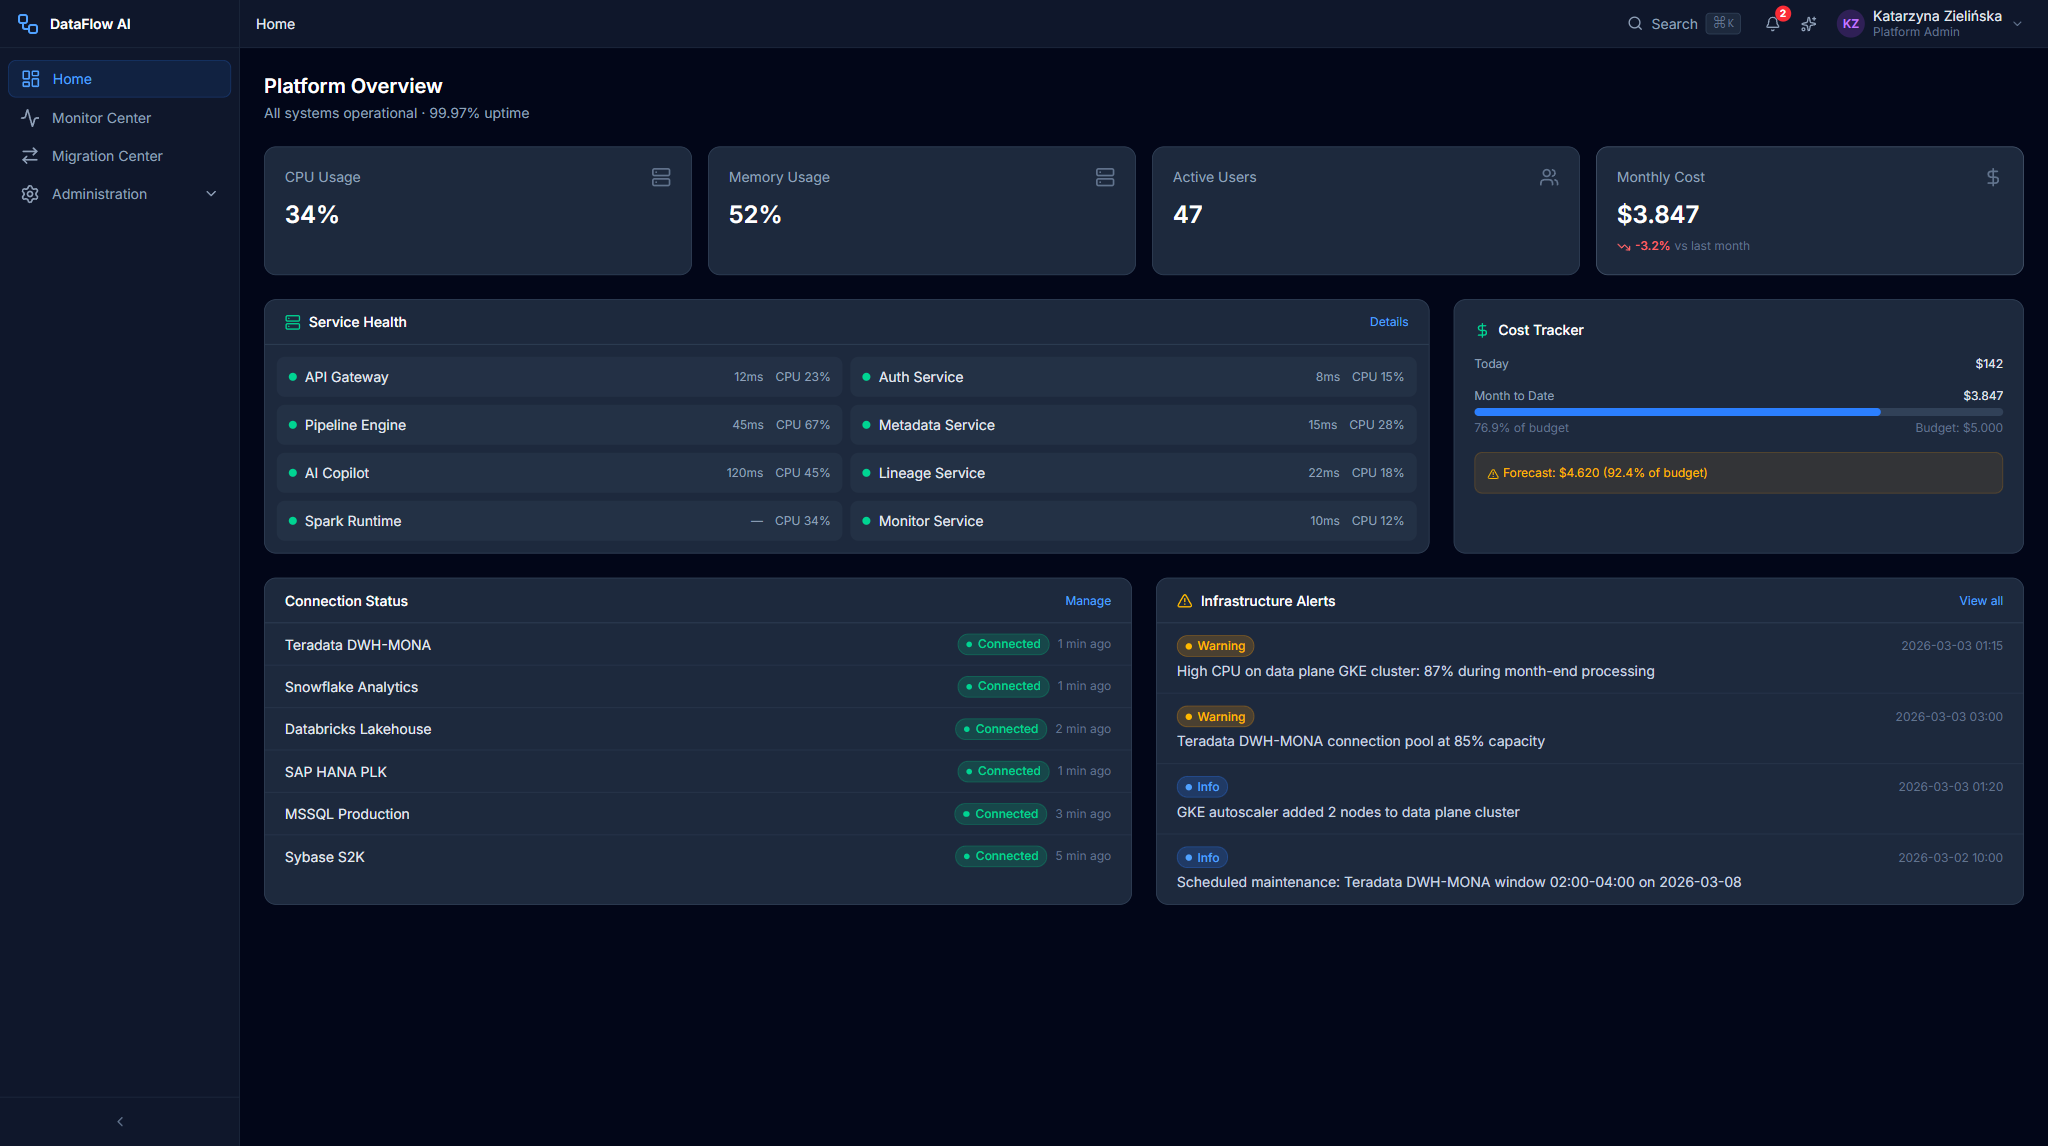
The console mounts at /admin (entry src/pages/AdminConsole.tsx). It swaps the standard application sidebar for a dedicated AdminSidebar with five primary items and a Quick Stats footer.
+----------------------------------------------------------+
| DATAFLOW AI                          Katarzyna Z. [v]    |
+----------------------------------------------------------+
| << Back to Platform                                       |
|                                                           |
| ADMINISTRATION                                            |
|   [icon] Users & Workspaces      -> /admin/users          |
|   [icon] Security                -> /admin/security       |
|   [icon] Infrastructure          -> /admin/infrastructure |
|   [icon] Cost Management         -> /admin/costs          |
|   [icon] Environments            -> /admin/environments   |
|                                                           |
| QUICK STATS                                               |
|   Active Users: 47                                        |
|   Services: 8/8 UP                                        |
|   Month Cost: $3,847                                      |
+----------------------------------------------------------+
The five sections fan out into roughly sixteen admin sub-pages and panels: Users grid, Workspaces grid, AD Group Mapping, Create/Edit User dialog, Workspace detail panel, SSO/AD config, RBAC Roles matrix, Active Sessions, API Keys, security Audit Log, GKE Cluster status, Service Health, Connection Status, Connector Configuration, Cost Management, and Environment Management.
User & Workspace Management
Route: /admin/users — entry src/pages/admin/UserManagementPage.tsx.
This page has two tabs — Users and Workspaces.
Users tab
+-----------------------------------------------------------------------+
| Users & Workspaces                              [+ Create User]       |
+-----------------------------------------------------------------------+
| [Users]  [Workspaces]                                                 |
+-----------------------------------------------------------------------+
| Search: [____________]   Role: [All v]   Status: [All v]             |
+-----------------------------------------------------------------------+
| Name           | Email             | Role          | Workspace | Last Active | Status | Actions |
|----------------|-------------------|---------------|-----------|-------------|--------|---------|
| Anna Kowalska  | a.kowalska@plk.pl | Data Engineer | DWH Team  | 09:12 today | Active | [E] [D] |
| Marek Nowak    | m.nowak@plk.pl    | Business Anal.| Analytics | 08:45 today | Active | [E] [D] |
+-----------------------------------------------------------------------+
| Showing 1-10 of 47 users                          [< 1 2 3 4 5 >]   |
+-----------------------------------------------------------------------+
The filterable user grid shows an avatar (initials, role-colored), name, email, role badge, workspace, last-active relative time, a status dot (green active / slate inactive / red locked), and inline Edit / Deactivate actions on every row. A filter bar above the grid filters by search text, role, and status.
Below the grid is a collapsible Active Directory Group Mapping table — each row maps an AD group to a platform role and a workspace scope, with a live member count.
| AD Group | Platform Role | Workspace Scope | Members |
|---|---|---|---|
| PLK-BI-Admins | Org Admin | All Workspaces | 3 |
| PLK-BI-Engineers | Developer | DWH Team, CDR Processing | 14 |
| PLK-BI-Analysts | Analyst | Analytics Team | 8 |
| PLK-BI-Operations | Operator | All Workspaces | 5 |
| PLK-BI-Governance | Data Steward | Governance Team | 4 |
| PLK-BI-Viewers | Viewer | Analytics Team | 13 |
Create / Edit User dialog
The 640px dialog handles both creation and editing (edit mode is detected from the presence of a user). Fields: full name (required, min 2 chars), email (required, must match *@plk.pl), role, workspace, AD groups, status (Active/Inactive), and notification toggles for email, Slack, and PagerDuty on-call.
Click-path — onboard a new user
- Open
/admin/usersand stay on the Users tab. - Click + Create User (top right) — the user dialog opens.
- Enter the full name and the
*@plk.plemail address. - Select a Role (Data Engineer, Business Analyst, Data Steward, Developer, Operator, Viewer, Workspace Admin, or Org Admin).
- Select the Workspace the user belongs to.
- Add any AD Groups — these drive role and workspace scope via federation.
- Set the Status to Active and choose notification channels.
- Click Create User. The new user appears in the grid; the action is recorded in the audit log.
Workspaces tab
The Workspaces tab shows a card per workspace — member count, environment count, pipeline count, storage used, and CPU/memory/storage quota utilization percentages. Clicking View Details opens a slide-over (or sub-page) with the member list, the per-environment summary (Development / Staging / Production), and resource-quota bars.
Behind the scenes
api/admin.ts serves users, workspaces, and audit logs. Real authorization is hasRole('ADMIN') on the metadata-service UserController and WorkspaceController. AD group mappings are synchronized from the LDAP federation provider on a periodic schedule.
Security Configuration
Route: /admin/security — entry src/pages/admin/SecurityPage.tsx.
The Security page has five tabs: SSO/AD Config, RBAC Roles, Active Sessions, API Keys, Audit Log.
SSO / AD Config
A read-only view of the identity configuration with an Edit Config button. It shows the Keycloak/OIDC identity provider settings, the Active Directory LDAP federation settings (domain, LDAP server, base DN, search bases, bind user, sync interval), and the session policy.
| Setting | Value |
|---|---|
| Identity provider | Keycloak (OpenID Connect / OIDC) |
| Realm | dataflow |
| SPA client | dataflow-app (public client, PKCE S256) |
| Service client | dataflow-api (confidential, client-credentials) |
| AD federation | ldaps://ad.polkomtel.internal:636, READ_ONLY |
| Access token lifespan | 15 minutes |
| SSO session idle | 30 minutes |
| Brute-force protection | Enabled — locks after 5 failures, up to 900s wait |
RBAC Roles
A permission matrix of the nine system roles against the permission domains — Pipelines, Connections, Environments, Users, System. A + Custom Role button adds non-system roles.
| Role | Pipelines | Connections | Users | System |
|---|---|---|---|---|
| Org Admin | Full | Full | Full | Full |
| Workspace Admin | Full (WS) | Full (WS) | Manage | Read |
| Developer | CRUD+Execute | Read+Use | None | None |
| Data Engineer | CRUD+Execute | CRUD | None | None |
| Business Analyst | Create+Read+Execute | Read+Use | None | None |
| Analyst | Read+Execute | Read+Use | None | None |
| Data Steward | Read+Approve | Read | None | Audit |
| Operator | Execute+Monitor | Read | None | Monitor |
| Viewer | Read | Read | None | None |
The backend RBACService reconciles this to five canonical DataFlowRole levels — ADMIN 100, ENGINEER 75, ANALYST 50, STEWARD 40, VIEWER 25 — and a role grants any permission whose required-role level is at or below it.
Active Sessions
A grid of currently authenticated sessions — user, IP address, location, device/browser/OS, started time, idle duration — with a Revoke action per row and Revoke All Sessions in the header.
API Keys
A grid of platform API keys — name, masked key prefix, scope, created/expires dates, status. Status is color-coded: green active, amber expiring (within 14 days), red expired, slate revoked. Each row exposes Rotate and Delete; a + Generate Key button creates a new key.
Click-path — review the audit log
- Open
/admin/securityand select the Audit Log tab. - Set the Date Range to the period under review.
- Optionally filter by Category (Auth, RBAC, API, Security, System, Data), Severity (INFO/WARN/ERROR/CRITICAL), or a specific user.
- Click Apply Filters.
- Scan the rows — WARN rows are amber-tinted, ERROR rows red, CRITICAL rows red with a white badge. Each row shows timestamp, severity, category, user, event, and detail.
- Page through results; export to SIEM if a deeper investigation is needed.
Behind the scenes
The audit log is written by the gateway's AuditInterceptor, which dual-writes a structured JSON line for SIEM and an asynchronous database row for every mutating /api/** request. Entries retain for 365 days. The metadata-service AuditLogController restricts read access to hasRole('ADMIN').
Connections & credentials
Data connections are the credentialed links between DataFlow AI and Polkomtel's source and target systems (Teradata, Snowflake, SAP HANA, Databricks, Oracle, MSSQL, Sybase, Kafka, GCS, and file sources). Admins create and test connections; engineers consume them in Design Studio pipelines.
Connections are surfaced in the Connection Status section of the Infrastructure dashboard and managed via the connection wizard reached from the Connector Marketplace.
Click-path — create a connection
- Open the Connector Marketplace (
/marketplace) and pick the connector for the target system, or open the connection wizard directly. - Click New Connection on an installed connector card — the wizard opens at
/connections/new?connector={id}. - Enter the connection name and host/endpoint details.
- Enter the credentials — these are stored encrypted, never echoed back in plaintext.
- Choose the workspace scope for the connection.
- Click Test Connection — the platform performs a live connectivity check and reports success or the connection error.
- On success, Save. The connection becomes selectable as a source or target node in Design Studio.
Behind the scenes
The metadata-service ConnectionController guards reads to the five canonical roles; create, edit, and test require ADMIN or ENGINEER; delete requires ADMIN. The ConnectorController serves the marketplace catalog. PII masking on the gateway scrubs credentials and sensitive values from any error response.
Infrastructure, Cost & Environments
Infrastructure Dashboard
Route: /admin/infrastructure — entry src/pages/admin/InfrastructurePage.tsx. A single scrollable dashboard with four sections.
GKE Cluster Status shows two clusters side by side — a Control Plane cluster (df-control-eu-c2) and a Data Plane cluster (df-data-eu-c2), both running GKE Autopilot in the europe-central2 region. Each panel reports the cluster name, region, mode, running status, node count, and Kubernetes version. Below the clusters, two Recharts gauge charts show CPU utilization (e.g. 34% of 80 cores) and memory utilization (e.g. 52% of 320 GB), followed by a pod summary line — running, pending, failed, and total pod counts.
Service Health lists the platform's microservices with an up/down indicator per service; the sidebar Quick Stats footer mirrors this as 8/8 UP. Connection Status reports the live health of every registered data connection. Connector Configuration surfaces the installed connector catalog and its per-connector settings.
| Cluster | Role | Region | Mode | Nodes |
|---|---|---|---|---|
df-control-eu-c2 | Control plane | europe-central2 | Autopilot | 6 |
df-data-eu-c2 | Data plane | europe-central2 | Autopilot | 12 |
Cost Management
Route: /admin/costs — cloud cost tracking and forecasting. The page shows today's spend, month-to-date spend, the configured budget, a percentage-of-budget progress bar, and a month-end forecast. Costs are displayed in USD for cloud spend with PLN shown where appropriate, following the console's Polish-locale conventions (DD.MM.YYYY dates). The Platform Admin home dashboard mirrors this surface in a CostTrackerCard, and api/monitoring.ts also serves cost anomalies — unexpected spikes flagged for the admin to investigate.
Environment Management
Route: /admin/environments — environment promotion and configuration across Development, Staging, and Production. Each workspace carries its own environment set; the Workspace detail panel summarizes per-environment pipeline counts and CPU allocation. Environment Management is where an admin promotes a configuration between tiers and reviews the per-environment resource posture.
Behind the scenes
api/monitoring.ts serves cost summaries and anomalies; infrastructure status — cluster, service, and connection health — is read from the platform's monitoring endpoints. All reads are gated to hasRole('ADMIN') server-side.
Admin sub-page map
| Sub-page / panel | Route or surface |
|---|---|
| User grid | /admin/users (Users tab) |
| Workspace grid | /admin/users (Workspaces tab) |
| AD Group Mapping table | section on Users tab |
| Create / Edit User dialog | modal on Users tab |
| Workspace detail panel | slide-over from Workspaces tab |
| SSO / AD Config | /admin/security (SSO tab) |
| RBAC Roles matrix | /admin/security (RBAC tab) |
| Active Sessions | /admin/security (Sessions tab) |
| API Keys | /admin/security (API Keys tab) |
| Security Audit Log | /admin/security (Audit Log tab) |
| GKE Cluster Status | /admin/infrastructure |
| Service Health | /admin/infrastructure |
| Connection Status | /admin/infrastructure |
| Connector Configuration | /admin/infrastructure |
| Cost Management | /admin/costs |
| Environment Management | /admin/environments |
API reference
| Concern | API module |
|---|---|
| Users, workspaces, audit logs | api/admin.ts |
| Cost summaries & anomalies | api/monitoring.ts |
| Access reviews | api/accessReviews.ts |
| Access revocation | api/accessRevocation.ts |
| Connections | api/connections.ts |
| Connectors | api/connectors (marketplace) |
All admin requests pass through the API Gateway. The gateway validates the Keycloak JWT, enforces the audience claim, and injects X-User-* identity headers; the downstream metadata-service re-validates the JWT and applies hasRole('ADMIN') method security.