Users & journeys
Analyst & Steward guide
This guide covers two personas whose work is closely linked: Marek Nowicki, the Business Analyst who produces and consumes data extracts without writing code, and Tomasz Wiśniewski, the Data Steward who governs and certifies that same data. Every journey is a numbered, step-by-step walkthrough mapped to concrete screens and routes.
Part 1 — Business Analyst journeys
Marek's defining constraint is simple: no coding required. The platform targets 30 minutes from his first login to a working pipeline, and his interface is a deliberately simplified subset of the engineer's.
His backend role is ANALYST (level 50); his Keycloak realm role is analyst; his UX persona is analyst. His allowed route prefixes are /, /my-pipelines, /data-browser, /marketplace, /monitor, /governance/quality, and /governance/lineage. He can view and run pipelines and use the AI Copilot, but he cannot create, edit, deploy, or delete pipelines through engineer-grade tooling — the AI builds them for him.
Journey 1 — 30-minute onboarding
The goal: from first login to a scheduled, monitored pipeline in under 30 minutes.
- SSO login. Marek signs in. The platform greets him — "Welcome Marek!" — with his role shown as Analyst and his workspace set to the Analytics Team.
- Guided tour. A 5-minute interactive tour walks him through the Design Studio.
- AI-guided first pipeline. In the AI Chat he types a plain request: "I need daily sales from SAP HANA." The AI generates a 3-node visual pipeline — Source → Filter → Target — and Marek previews the first 100 rows at each node.
- Schedule and monitor. He sets the schedule to "Daily at 8 AM". His dashboard now shows the pipeline's running status.
Screens: Keycloak login, onboarding tour, AI Copilot chat, Design Studio, schedule dialog, HomeDashboard (analyst variant).
| Onboarding metric | Target |
|---|---|
| Time to first pipeline | < 30 minutes |
Journey 2 — AI-guided self-service extract
This is Marek's everyday journey: turning an ad-hoc data request into a working extract through conversation.
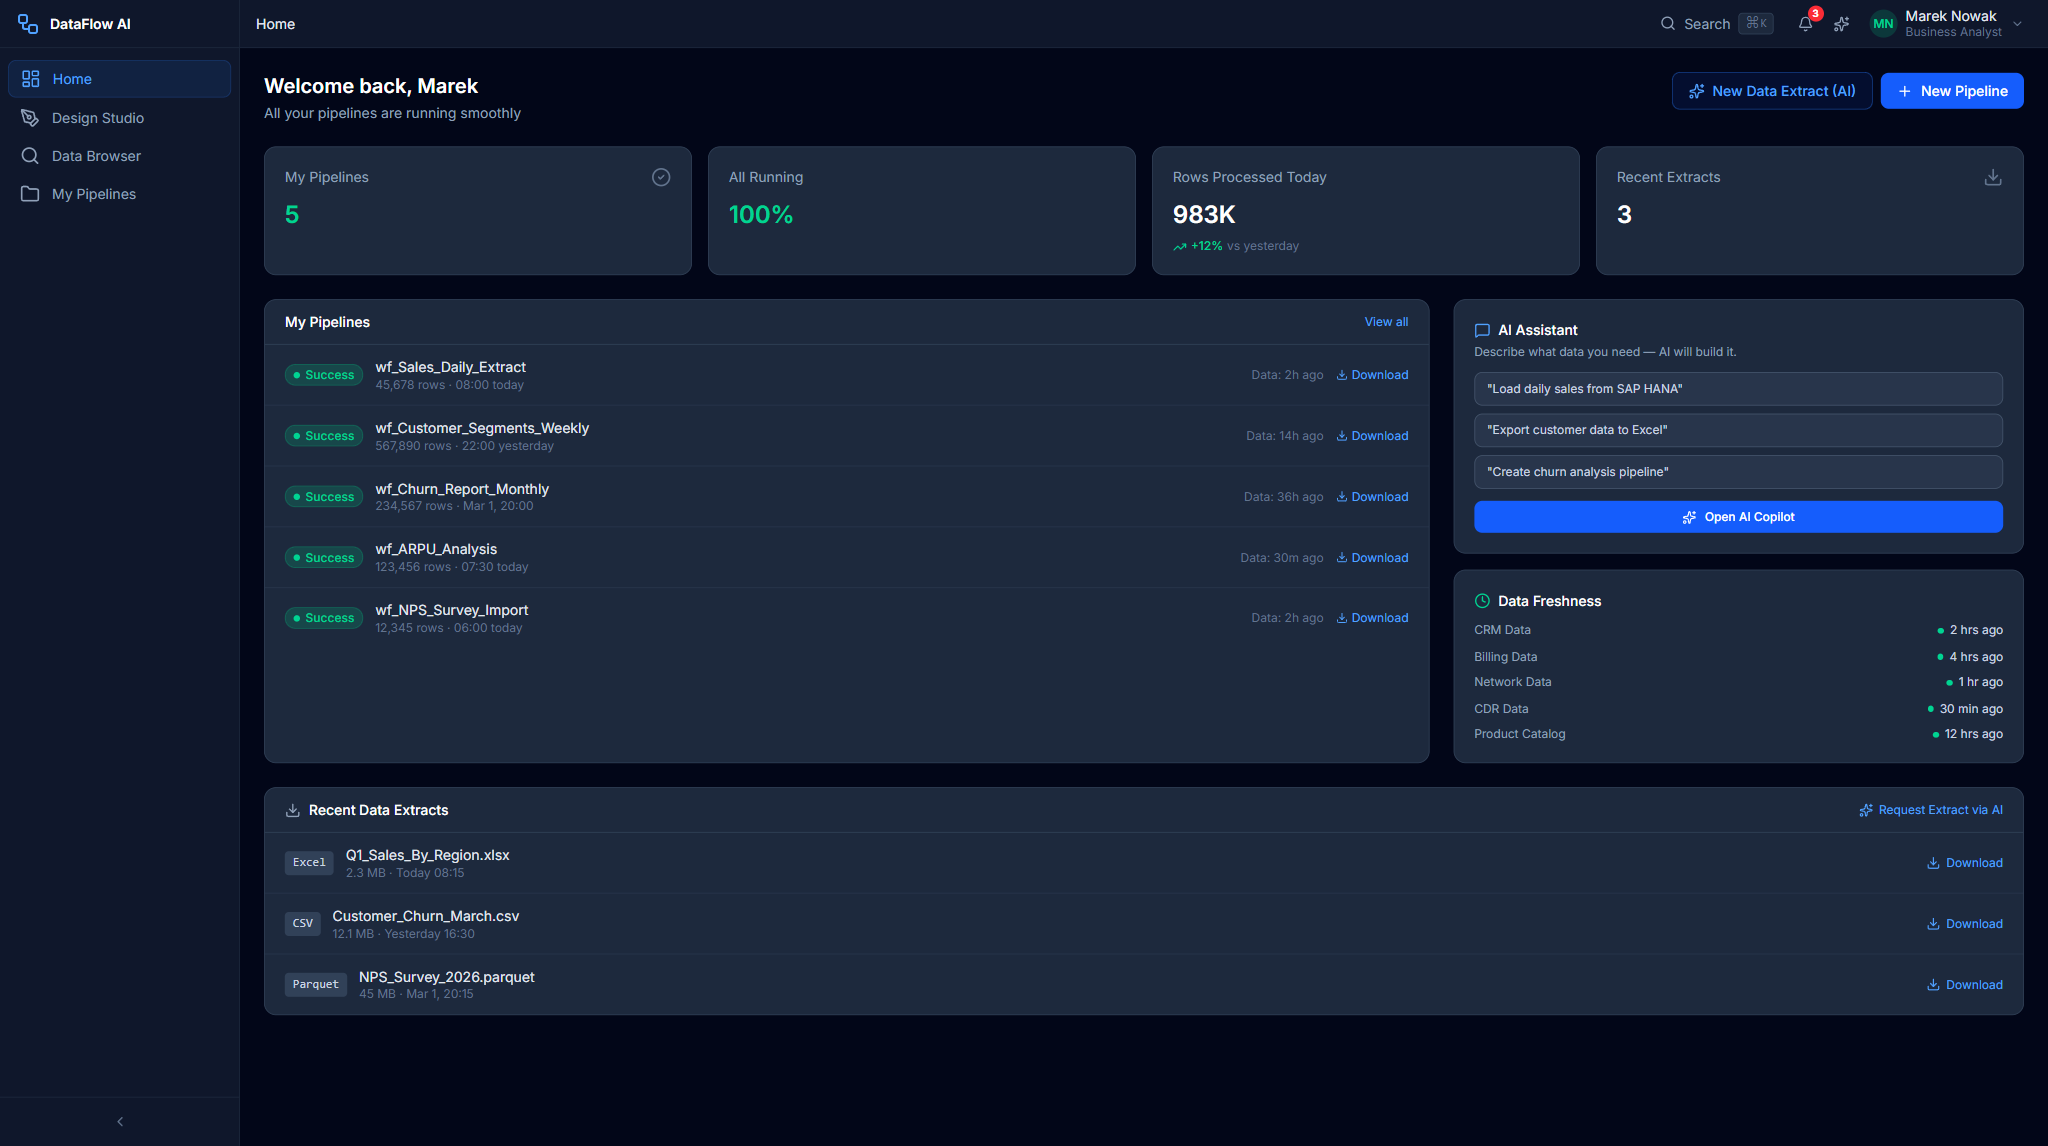
- Open the dashboard. Marek's Home Dashboard (analyst variant) shows "My Pipelines" — all 5 ran successfully — and a
DataFreshnessCardconfirming the data is fresh. - Ask in AI Chat. He clicks the sparkle trigger to open the AI Copilot, then the Chat tab, and types: "Export customer data from Teradata for Q1 2026."
- Review the AI plan. The AI replies with a
MiniPipelineDiagram— a lightweight SVG source → transform → target sketch — and a plan that creates a pipeline with an Excel output to GCS. - Confirm or adjust. Marek clicks "Yes, create". The pipeline is scaffolded in the Design Studio, where he fine-tunes it by dragging a filter node in the visual designer — no code.
- Schedule. For a recurring report he sets a schedule; for a one-off he runs it immediately.
For a monthly report he chains this further: a scheduled extract from multiple sources, aggregated by region, product, and date, output to Snowflake to feed the BI dashboard.
Screens: HomeDashboard (analyst), MyPipelinesCard, DataFreshnessCard, AIChatQuickEntry, AI Copilot chat, MiniPipelineDiagram, Design Studio visual designer, ScheduledPipelinesTable.
Plain-language errors
When an analyst's pipeline fails, the platform shows plain-language error messages with guided resolution rather than raw stack traces — a UX innovation built specifically for the Analyst persona.
Journey 3 — Self-service catalog exploration
Before building anything, Marek often needs to find the right data. The Data Browser is his catalog.
- Open the Data Browser. He navigates to
/data-browserand uses the large search bar. - Search. He searches "churn". Twelve related tables and views come back, ranked by relevance and popularity.
- Browse a table. He opens a result to see its columns, statistics, and sample data, including column-level profiling with histograms.
- Ask the AI. Unsure what a column means, he asks the AI Copilot "What does this column mean?" — the AI explains, e.g. "CHURN_SCORE is a 0–100 index calculated monthly...".
- Build from the table. He clicks "Create pipeline from this table", which drops an instant pipeline stub into the Design Studio.
Screens: Data Browser landing, search results, Table Detail (Columns, Sample Data, Profiling tabs), column-level lineage, AI Copilot.
Part 2 — Data Steward journeys
Tomasz's role is investigative and gate-keeping. He ensures data quality and governance across Polkomtel's estate.
His backend role is STEWARD; his UX persona is steward. His allowed route prefixes are /, /monitor, /governance, /data-browser, /marketplace, /admin/audit-log, and /admin/access-reviews. The front-end persona model grants him rich governance, quality, and catalog permissions — review, approve, policy, lineage edit, quality create/edit, and catalog classify.
Journey 4 — Lineage investigation
A request arrives: "Where does CUSTOMER_CHURN_SCORE come from?"
- Open the Lineage Explorer. Tomasz navigates to Governance Hub → Lineage Explorer (
/governance/lineage). - Search. He searches "CHURN_SCORE" in the typeahead search bar.
- Read the graph. An interactive D3.js graph renders the full path:
SAP_HANA.CRM.CUSTOMER_ACTIVITY→ pipelinewf_customer_360(transformML_SCORE_CALC, Python UDFchurn_model.py) →Snowflake.DWH.DIM_CUSTOMER.CHURN_SCORE→Databricks.Analytics.churn_dashboard. - Adjust the level. He uses the Lineage Level toggle to switch between pipeline, table, and column granularity.
- Inspect a node. Clicking a node opens the 320px detail panel — type, owner, quality score, tags, description, and upstream/downstream counts.
- Run impact analysis. He clicks Show Impact Analysis to open a modal grouping downstream dependencies by severity (Critical / High / Medium / Low), exportable for a change-review.
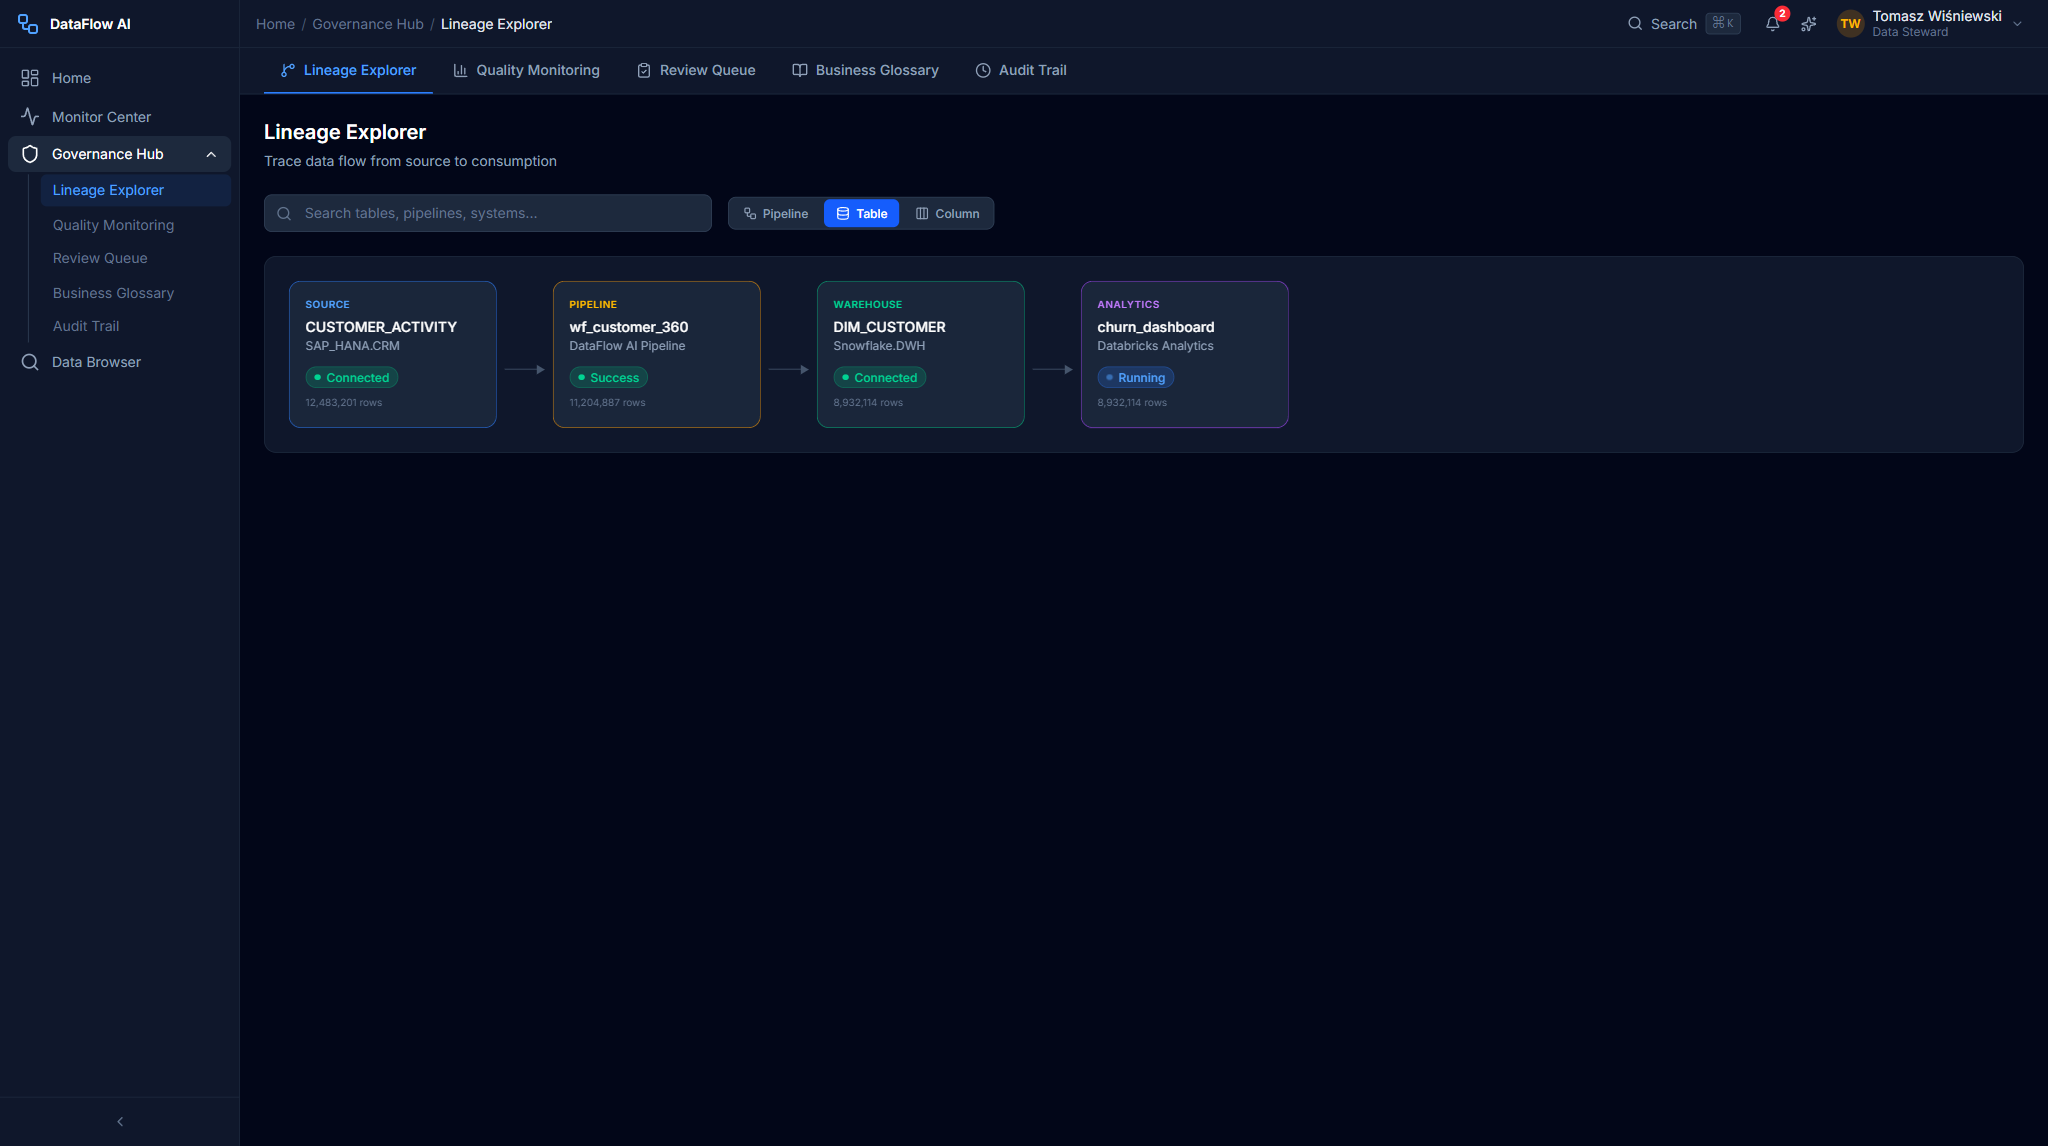
Screens: LineageExplorerPage, LineageSearchBar, LineageLevelToggle, LineageGraph, LineageDetailPanel, ImpactAnalysisModal.
Journey 5 — Governance review and certification
Walkthrough of reviewing the pipeline wf_Subscriber_Churn_v2 before it is deployed.
- Engineer submits. An engineer submits the pipeline for governance review before staging or production deployment.
- Open the review queue. Tomasz opens the Governance Review Queue (
/governance/reviews) and selects the pending pipeline, which opens Review Detail (/governance/reviews/:reviewId). - Read the automated checks. Governance is non-blocking — automated checks run in the background and produce a governance score out of 100. For this pipeline the checks return:
- PASS: all 12 PII columns identified and tagged; data masking applied for the Analyst role; a 36-month retention policy; audit logging for PII access; complete source-to-target lineage; 12 quality rules defined; no cross-region transfer.
- WARN: 2 columns lack business descriptions.
- Score: 94 / 100 (the threshold is 90).
- Review in detail. Tomasz inspects the diff view, the impact analysis, and the discussion thread.
- Decide. He chooses Approve, Request Changes, or Reject with Reason. An approved pipeline may then be scheduled for production.
Screens: GovernanceReviewPage, ReviewQueueList / ReviewQueueItem, GovernanceReviewDetailPage (diff view, impact analysis, discussion thread, action bar).
Two review paths
The platform has two overlapping review gates: a Manager-approval deployment review (from the user guide) and the Steward governance review with an automated score described here. Treat the first as a deployment approval and the second as a governance certification.
Journey 6 — Quality monitoring
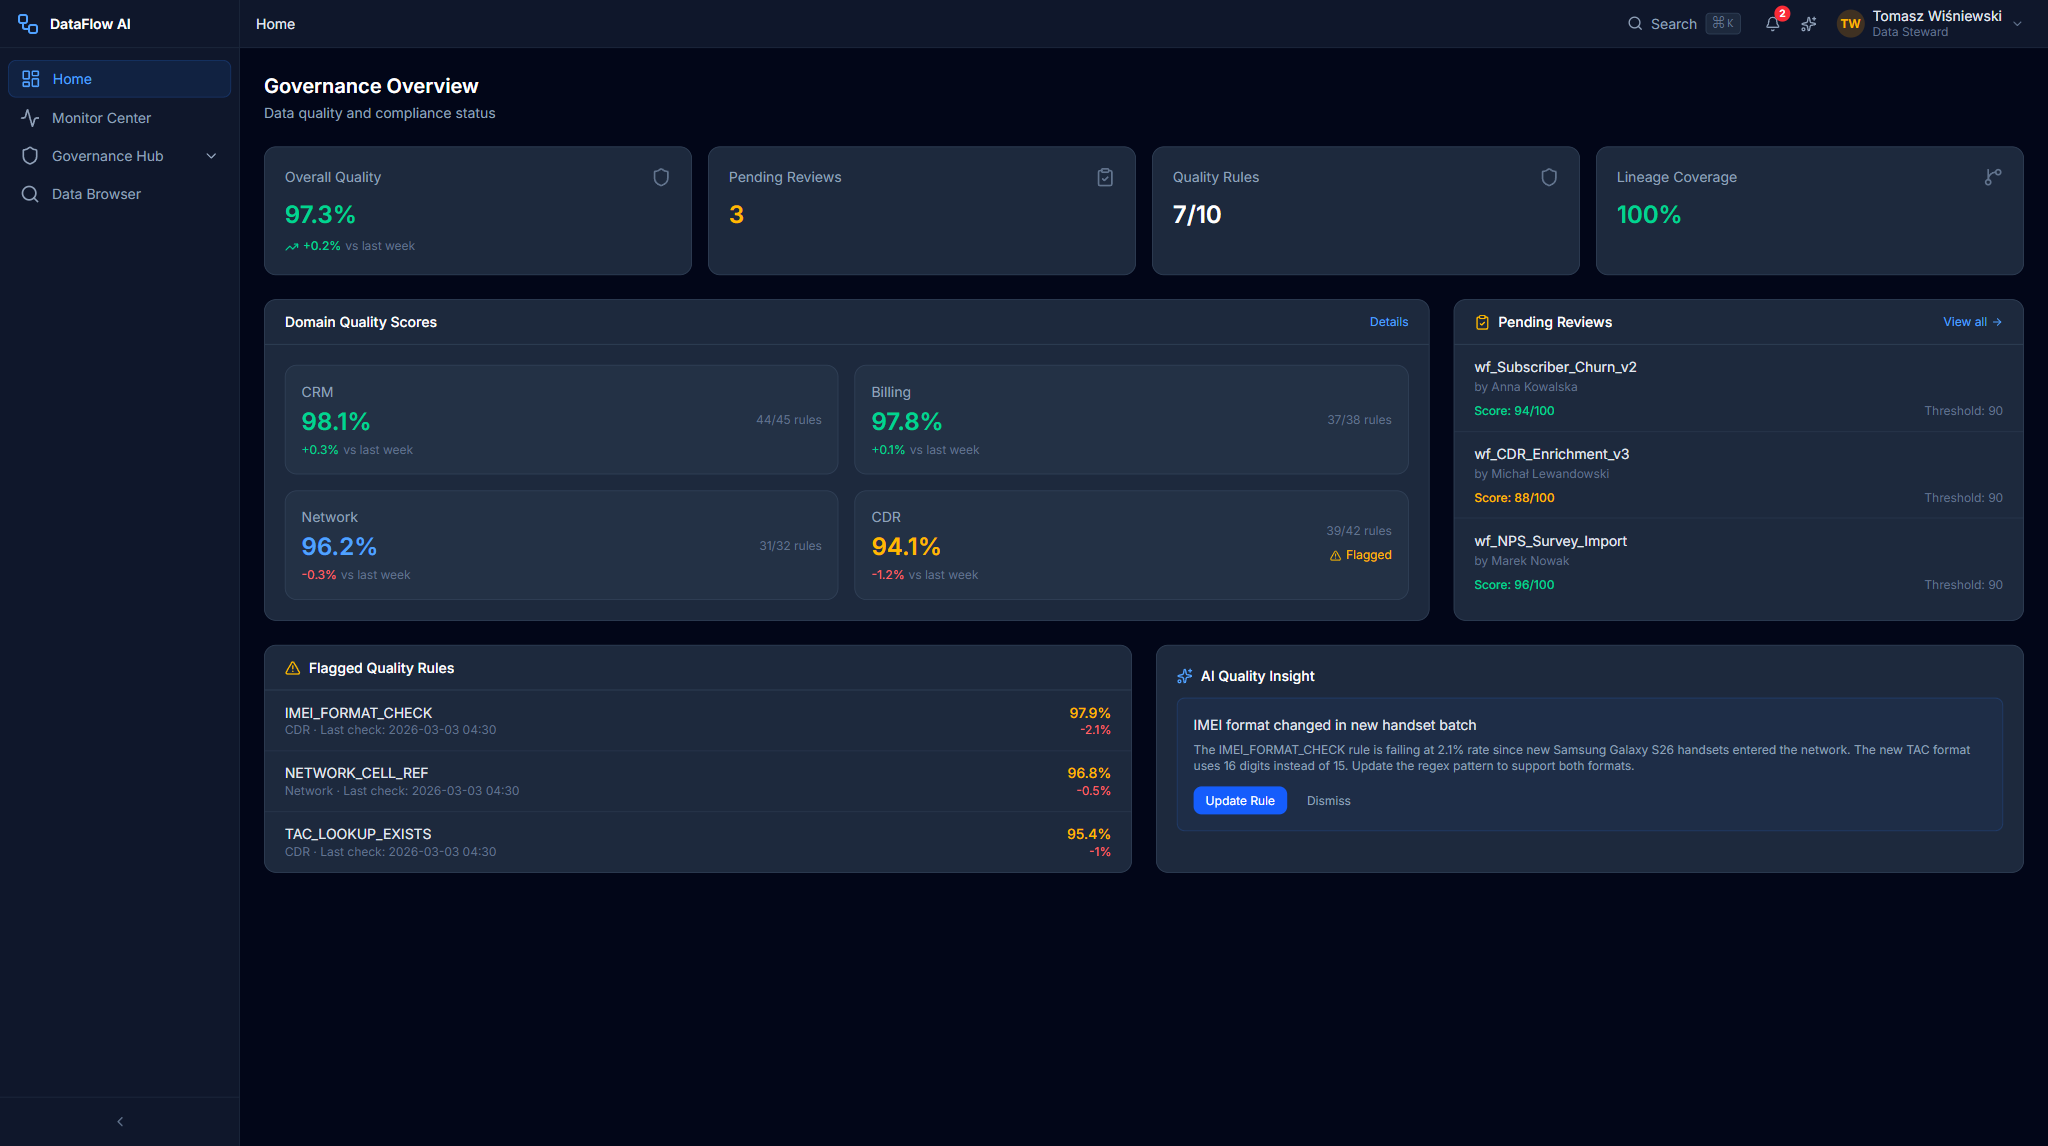
- Open the Quality dashboard. Tomasz navigates to
/governance/quality. The Overall Quality Score gauge shows, for example, 97.3% — up 0.2% week-over-week. - Drill into a domain. He sees four domain cards — CRM, Billing, Network, CDR. The CDR card has a red border and a pulsing dot: its score is 94.1%, down 1.2%.
- Find the failing rule. Clicking the CDR card filters the Quality Rules grid. The rule
IMEI_FORMAT_CHECKis failing at a 2.1% rate. - Read the AI insight. The AI Quality Insight card explains the cause: "IMEI format changed in new handset batch — update the regex pattern."
Screens: QualityMonitoringPage, QualityScoreGauge, DomainQualityCard, QualityTrendChart, QualityRulesGrid, AIQualityInsight.
Journey 7 — Glossary and audit
Business glossary
Tomasz maintains telecom-specific terms in the Business Glossary — for example, an ARPU rule validating values in the PLN 0.00–999.99 range. He searches and edits terms through GlossarySearchBar, GlossaryGrid, and GlossaryTermDetail.
Audit trail
- He opens the Audit Trail (
/governance/audit) to review governance-related activity. - He filters by category — for example,
SECURITY. - He exports the filtered events as CSV.
Every state-changing operation is logged with the user ID, IP address, action, resource, timestamp, and a JSON detail blob. Audit logs are retained for 365 days and are exportable to a SIEM.
Compliance reports
Tomasz generates compliance reports — a GDPR Data Map, a PII Inventory, and an Access Audit — and exports them as PDF or CSV.
Screens: AuditEventRow, AuditFilterBar, compliance report generators.
Journey → screen cross-reference
| Journey | Persona | Entry route | Key screens / components |
|---|---|---|---|
| 30-min onboarding | Analyst | /onboarding | Keycloak login, tour, AI Copilot, Design Studio |
| AI-guided extract | Analyst | /ai-copilot | AIChatQuickEntry, AI Copilot chat, MiniPipelineDiagram, Design Studio |
| Catalog exploration | Analyst | /data-browser | Data Browser, schema explorer, column lineage, AI Copilot |
| Lineage investigation | Steward | /governance/lineage | LineageGraph, LineageDetailPanel, ImpactAnalysisModal |
| Governance review | Steward | /governance/reviews | ReviewQueueList, GovernanceReviewDetailPage, governance score |
| Quality monitoring | Steward | /governance/quality | QualityScoreGauge, DomainQualityCard, AIQualityInsight |
| Audit & compliance | Steward | /governance/audit | AuditEventRow, AuditFilterBar, compliance reports |
Where to go next
- User journeys — the full journey index with ASCII maps.
- Data Engineer guide — the journeys for the persona who builds the pipelines.
- Administrator guide — platform operations and legacy migration.
- Personas & roles — how the Analyst and Steward personas map to backend roles.