Users & journeys
Administrator guide
This guide follows Katarzyna Zielińska, the Platform Admin persona, through the journeys that keep DataFlow AI running — from a cold three-day infrastructure build, through daily operations and user onboarding, into incident response. It closes with the Migration Specialist's four-phase legacy migration journey, performed by an engineer in the Migration Center. Every step is mapped to a concrete screen, tool, or route.
Before you start
The Platform Admin is the control-plane operator. Katarzyna's backend role is ADMIN (level 100 — the top of the hierarchy); her Keycloak realm role is the composite org_admin; her UX persona is admin. She has all 28 front-end permissions and full access to the Administration Console.
Her allowed route prefixes include /, /admin, /monitor, /migration, /design-studio, /governance, /connections, /pipelines, /data-browser, and /templates. Notably the Administration Console (/admin) is visible to the admin persona only.
Journey 1 — Initial platform setup
Standing up the platform takes three focused days.
Day 1 — Infrastructure
- Katarzyna runs
terraform applyagainst the IaC templates. - Terraform provisions a GKE Autopilot cluster in
europe-central2. - It provisions a Cloud SQL PostgreSQL instance for the platform's metadata.
Tooling: Terraform, GKE, Cloud SQL.
Day 2 — Security
- She configures Keycloak with Active Directory federation over LDAPS.
- She sets up Vault for credential management.
- She defines the RBAC roles and maps AD groups to them with Keycloak role mappers.
Tooling: Keycloak admin console, Vault, role mappers.
Day 3 — Connectivity
- She registers the connectors Polkomtel needs: Teradata, Snowflake, Databricks, SAP HANA, and MSSQL.
- She tests every connection.
- She sets up monitoring and alerting with Grafana and PagerDuty.
Tooling: connection registration API, Grafana, PagerDuty.
dev-permit-reads must stay false
The gateway and services have a development escape hatch, dataflow.gateway.dev-permit-reads. When true it permits all GET requests unauthenticated and grants the anonymous user a wide role set. It must be false in production — verify this as part of platform setup.
Journey 2 — Daily operations
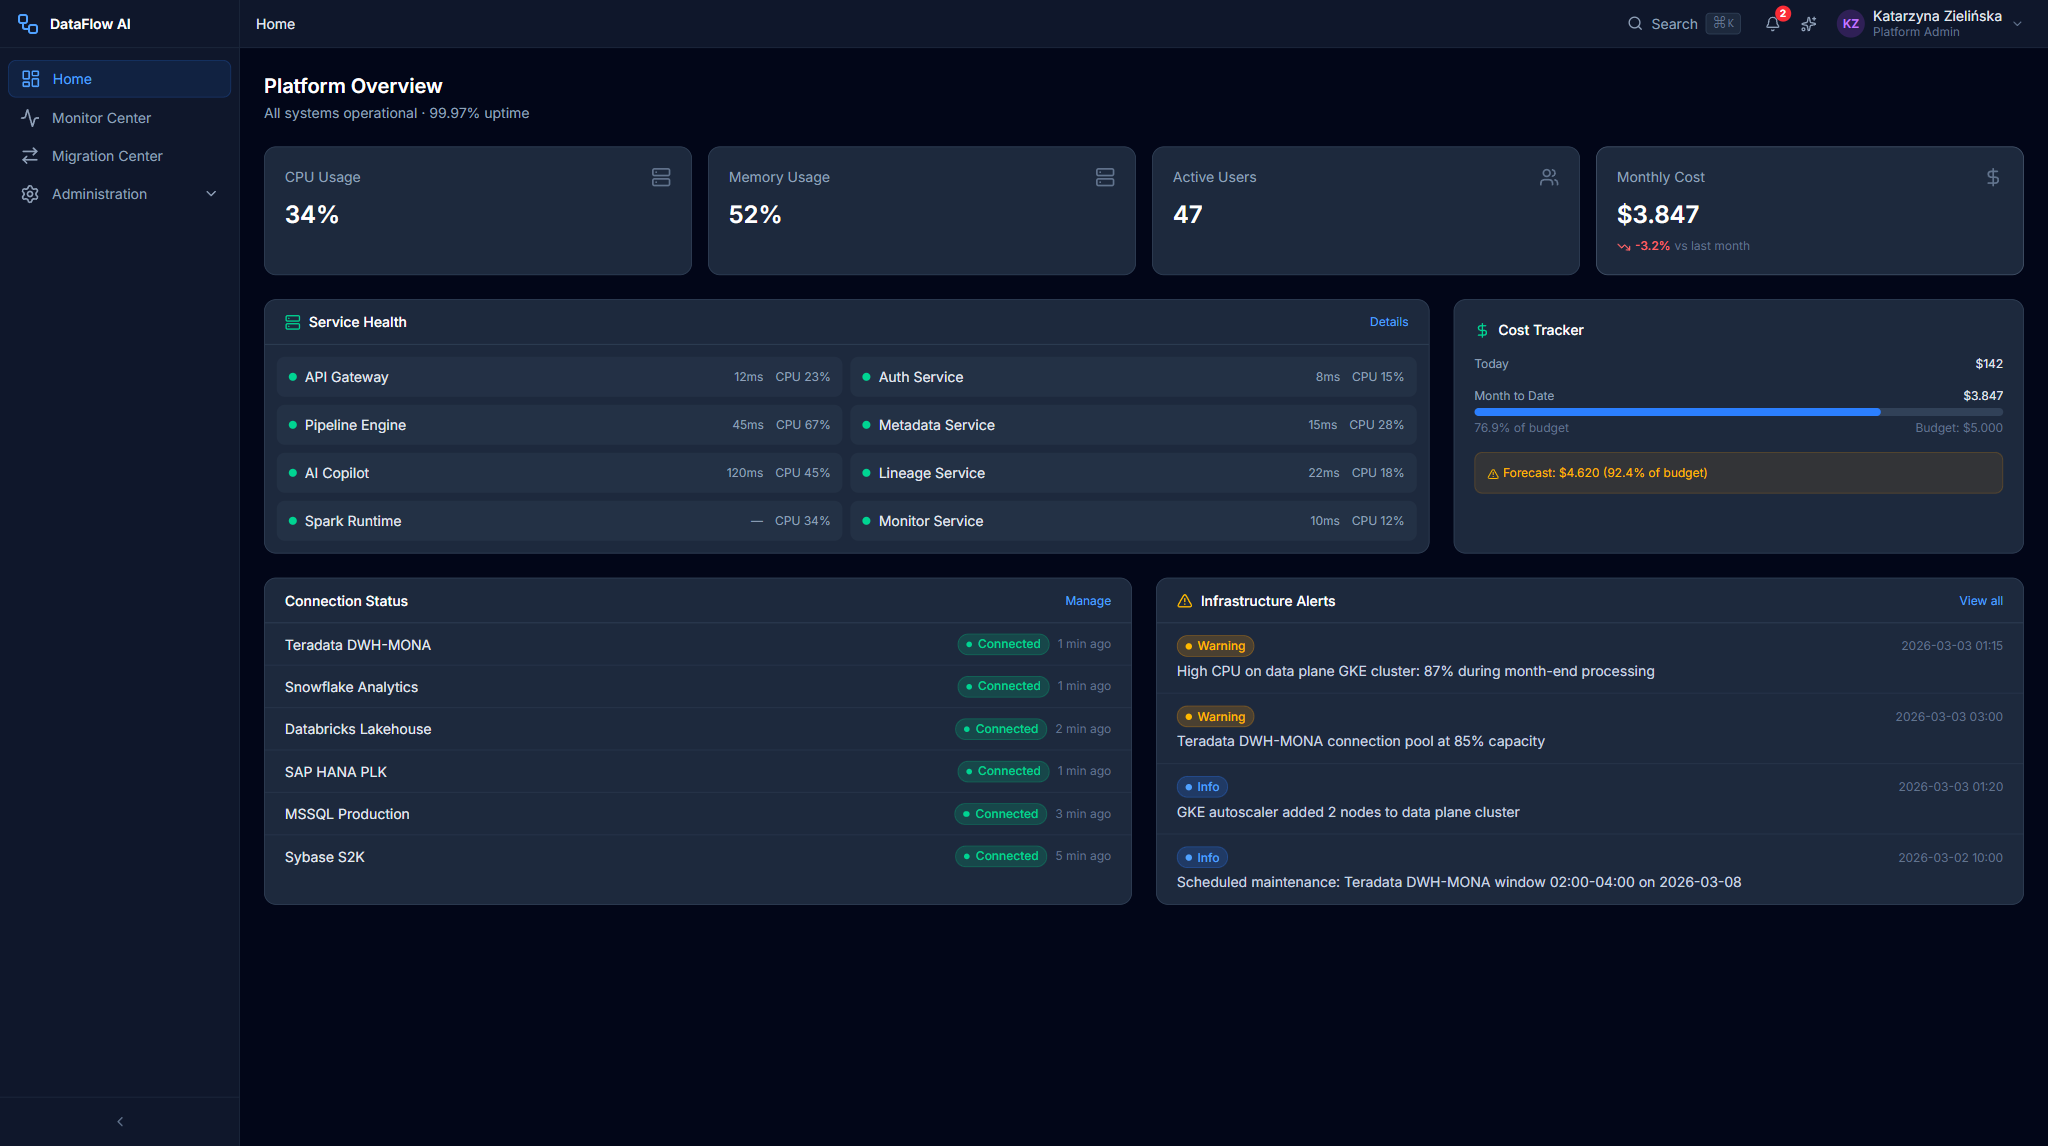
Katarzyna's day centers on the Administration Console and the admin variant of the Home Dashboard.
08:00 — Morning health check
- She opens the Admin Dashboard (
/dashboard, admin variant). - The
SystemHealthCardconfirms all services are UP, with CPU at 34% and memory at 52%. - The
CostTrackerCardshows spend — today $142, month-to-date $3,847 against a $5,000 budget.
Mid-morning — User management
- A new-user request arrives from the DBI team.
- Katarzyna assigns the user to a workspace and an environment.
- Their AD-group membership auto-provisions the correct permissions.
Scaling
- A high-CPU alert fires during the month-end peak.
- She reviews the usage patterns on the dashboard.
- GKE Autopilot auto-scales the cluster; she can apply a manual override if needed.
Screens: HomeDashboard (admin), SystemHealthCard, CostTrackerCard, ActiveUsersCard, InfrastructureAlertsCard, ScalingEventsCard, ServiceStatusTable, Administration Console.
Journey 3 — User and team onboarding
Adding a new user or team is a routine but multi-step journey.
- Provision the user. The user is synced from Active Directory via Keycloak federation, or created manually in Keycloak with a username, email, name, temporary password, and realm roles. In the Admin Console she uses Users tab → + Create User and fills the dialog (name, email
*@plk.pl, role, workspace, AD groups, status, notification toggles). - Assign workspace membership. She assigns the user to a workspace via the metadata-service API —
POST /workspaces/{id}/memberswith a role. - Create a workspace (if needed).
POST /workspaceswith a name, slug, and environment, plus resource quotas — concurrent runs, max pipelines, GCS storage, and Spark executors. - Register connections. She registers the workspace's data connections and tests connectivity with
POST /connections/{id}/test.
The Admin Console's AD Group Mapping table makes the link explicit: each row shows an AD group, the platform role it grants, the workspace scope, and the member count.
Screens: /admin/users (Users and Workspaces tabs), Keycloak admin console, workspace API.
Journey 4 — Incident response
Walkthrough of a real incident: pipeline failures spike at 02:00.
Step 1 — Detect and diagnose
- A PagerDuty P1 alert fires — 50+ pipeline failures.
- Katarzyna checks Grafana, which shows a Teradata latency spike at 01:55.
- Root cause: a conflict with a Teradata DWH maintenance window.
Step 2 — Coordinate
- She coordinates with the Teradata DBA team.
- Teradata is back online at 03:30.
Step 3 — Recover and learn
- She runs a bulk retry of all failed pipelines from their checkpoints.
- She updates the runbook — adding a Teradata maintenance-window blackout so the conflict cannot recur.
Screens: notification / alert panel, IncidentPanel, Monitor Center (admin-scoped), Grafana, PagerDuty.
Journey 5 — Legacy migration (Migration Specialist, four phases)
Legacy migration has no dedicated persona — it is performed by a Data Engineer working in the Migration Center, often in coordination with the Platform Admin. The RFI scope is 500+ PowerCenter workflows and 50–100 Alteryx workflows (roughly 550–600 assets). Targets: >85% auto-conversion for PowerCenter and >75% for Alteryx. A typical batch takes about six weeks.
Phase 1 — Assessment (Week 1)
- Upload the PowerCenter XML export — for example, 150 objects — into the Import Wizard (
/migration/import). - The wizard auto-detects the file type (PowerCenter XML / Alteryx YXMD / Unknown) and shows per-file cards with object counts.
- Click Analyze with AI. A 4-stage checklist runs — Parsing → Analyzing → Compatibility → Report — with a live scrolling analysis feed.
- Review the Compatibility Report: four summary cards (Total Objects, Auto-Convertible %, Manual Required %, Estimated Effort hrs), a Workflow Assessment table with complexity badges, an Object-Type breakdown chart, and a Risk Items panel. A typical result: 85% auto-convertible, 15% manual.
Screens: Import Wizard — FileUploadStep, AnalysisProgressStep, AnalysisFeed, CompatibilityReportStep, WorkflowAssessmentTable.
Phase 2 — Batch conversion (Weeks 2–3)
- Auto-convert the pipelines using AI plus rules — click Start Conversion to move to
/migration/conversion. - The Conversion Dashboard shows summary cards (Total, Auto-Converted donut, Manual donut, average confidence) and a Conversion Status by Object Type table — Source Qualifier, Expression, Lookup, Filter, Joiner, Custom Java, Router, Other.
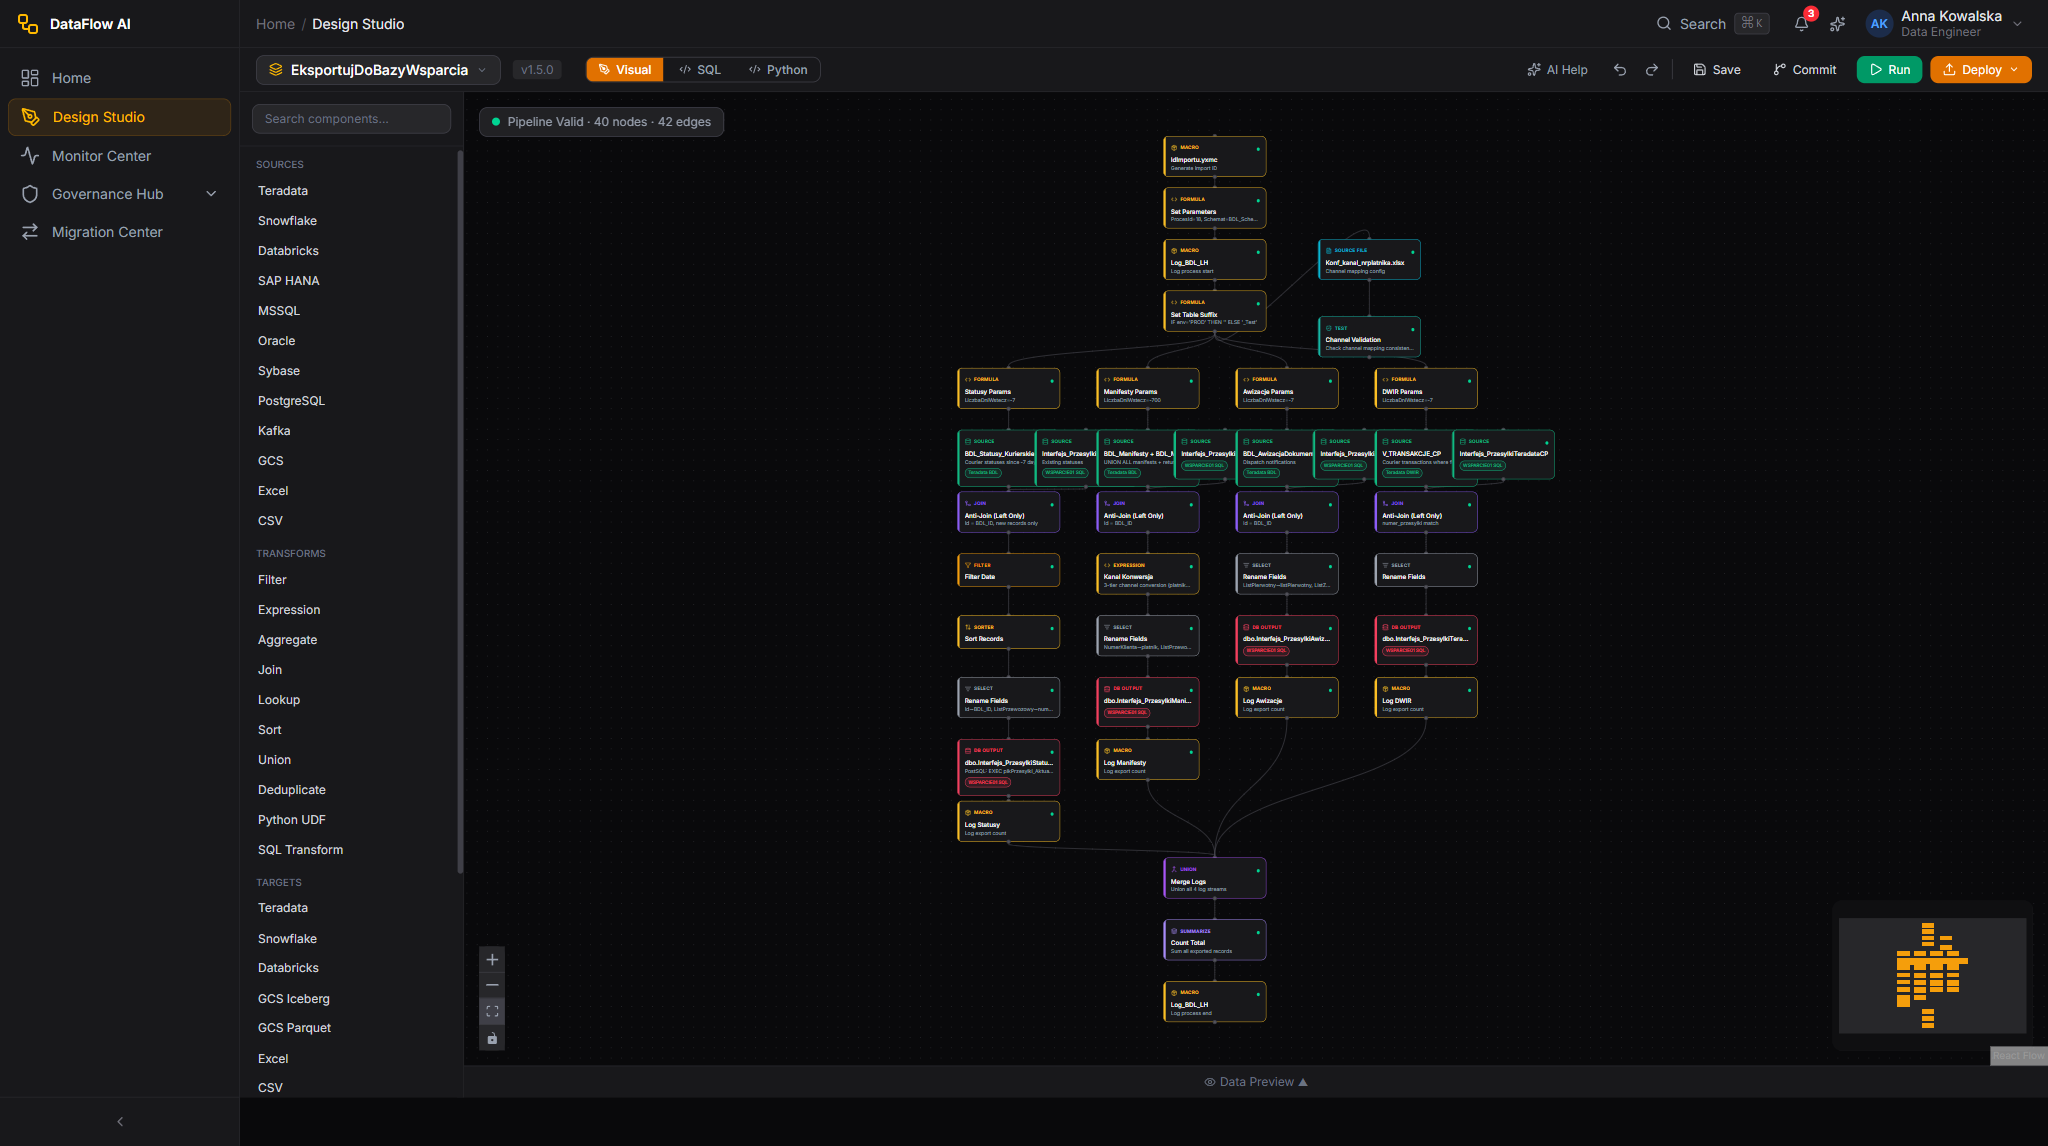
- Review each converted YAML pipeline in the Design Studio via the card's Open in Design Studio action.
- Fix flagged items — for example, 23 complex Java transforms that need manual attention.
Screens: Conversion Dashboard — ConversionSummaryCards, ObjectTypeConversionTable, ConvertedPipelineList, ConfidenceDistributionChart, RiskItemsPanel.
Phase 3 — Validation (Weeks 4–5)
- Open the Validation Suite (
/migration/validation) and click Run All Tests. - The suite runs data-parity tests comparing source against target — row counts, checksums, and column values.
- The Pipeline Comparison Table shows the results; failed rows expand to per-column
FailureDetail(expected vs. actual, diff type). - Fix discrepancies — for example, 3 edge-case pipelines.
Screens: Validation Suite — ValidationTestRunner, ValidationResultsTable, DataComparisonView.
Phase 4 — Cutover (Week 6)
- Run a parallel run — both the legacy system and DataFlow AI for one week.
- Validate that both produce identical results.
- Decommission the PowerCenter workflows.
- Track overall progress in the Migration Progress Tracker (
/migration/progress) — a phase timeline, a Gantt chart, a batch-progress view, an ETA card, a velocity metric, and risk items.
Screens: Migration Progress Tracker — PhaseTimeline, BatchProgress, MigrationEtaCard.
Single-file migration and the CLI
For a one-off migration, an engineer can upload a single PowerCenter .XML or Alteryx .yxmd file, review the migration report (conversion score, generated pipelines, warnings, side-by-side source/YAML view), then Validate and Import. The CLI equivalents are dataflow migrate upload --type powercenter -f export.xml, migrate status, and migrate report. The AI Copilot assists during review by explaining legacy logic.
Journey → screen cross-reference
| Journey | Entry route | Key screens / tools |
|---|---|---|
| Platform setup | (infrastructure) | Terraform, Keycloak admin, Vault, connection registration |
| Daily operations | /dashboard, /admin | SystemHealthCard, CostTrackerCard, ActiveUsersCard, Admin Console |
| User & team onboarding | /admin/users | Users and Workspaces tabs, Keycloak, workspace API |
| Incident response | /monitor, /admin | IncidentPanel, Monitor Center (admin-scoped), Grafana / PagerDuty |
| Legacy migration | /migration/import | Import Wizard, Conversion Dashboard, Validation Suite, Progress Tracker |
Administration Console reference
The Admin Console (/admin) has five sections plus a Quick Stats footer.
| Section | Route | Purpose |
|---|---|---|
| User & Workspace Management | /admin/users | Users grid, AD group mapping, workspace cards and quotas |
| Security Configuration | /admin/security | SSO/AD config, RBAC roles, active sessions, API keys, audit log |
| Infrastructure Dashboard | /admin/infrastructure | GKE status, service health, connection status, connector config |
| Cost Management | /admin/costs | Cost tracking and forecasting |
| Environment Management | /admin/environments | Environment promotion |
Common quick actions: create a user (/admin/users → + Create User), revoke a session (Security → Active Sessions → Revoke), and rotate an API key (Security → API Keys → rotate icon).
Where to go next
- User journeys — the full journey index with ASCII maps.
- Data Engineer guide — including the engineer's side of legacy migration.
- Analyst & Steward guide — the journeys for the data-producing and governing personas.
- Personas & roles — how the Admin persona maps to backend and Keycloak roles.