Feature guides
Governance Hub
The Governance Hub is the central data-governance surface of the DataFlow AI Platform — where Data Stewards trace lineage across Polkomtel's SAP HANA, Snowflake, Teradata, and Databricks estate, monitor quality across the CRM, Billing, Network, and CDR domains, certify data products, review pipelines before deployment, and run GDPR erasure workflows.
New here? What "data governance" means
Data governance is the set of rules and habits that keep an organisation's data trustworthy, well-documented, and legal to use. If a pipeline is the plumbing that moves data, governance is the building inspector who checks the plumbing is safe before anyone drinks the water.
The Governance Hub is where that inspection happens. In everyday terms it answers questions like:
- Where did this number come from? — tracing data back to its original source.
- Can I trust this table? — checking it passes quality rules and has been certified.
- Are we handling private data correctly? — making sure personal details are protected and the law is followed.
- Is this new pipeline safe to switch on? — reviewing and approving it before it reaches production.
A few terms you will meet on these screens:
- Lineage — the documented journey of data, from where it was created, through every transformation, to where it is used. "Column-level" lineage tracks each individual field, not just whole tables.
- PII — Personally Identifiable Information: any data that can identify a real person, such as a name, phone number, or the Polish national ID number (PESEL). PII is protected by law.
- GDPR / RODO — the European data-protection law (called RODO in Poland) that governs how personal data may be collected, stored, and used.
- DSAR — a Data Subject Access Request: a formal request from an individual to see, correct, or delete the personal data an organisation holds about them.
- Data quality — how complete, accurate, and consistent a dataset is. A quality rule is an automated check (for example, "the IMEI column must be 15 digits").
- Steward — the person responsible for governance: reviewing quality, approving pipelines, and handling privacy requests.
Most of this runs automatically
You do not have to police data by hand. The platform scans for PII, scores quality on every run, and computes a governance score for each pipeline. The Governance Hub mostly shows you what the platform already found — your job is to review, approve, and act on the exceptions.
Who uses the Governance Hub
The Governance Hub is the primary workspace for the Data Steward persona (Tomasz Wiśniewski). Data Engineers and Platform Admins use it as a secondary surface — engineers to inspect lineage of pipelines they build, admins to review the governance audit trail.
| Persona | Typical tasks here |
|---|---|
| Data Steward | Trace lineage, run quality reviews, certify data products, approve pipeline reviews, run DSAR erasures |
| Data Engineer | Check downstream impact before changing a column, read AI quality insights |
| Platform Admin | Inspect the immutable governance audit trail |
Route enforcement: the steward persona is allowed the /governance route prefix; engineer and admin personas also have /governance access, while the analyst persona is restricted to /governance/quality and /governance/lineage only. Real authorization is enforced server-side — the SPA route guard is UX only.
Note
The frontend persona model grants steward rich governance:policy, governance:review, governance:approve, quality:create/edit, lineage:edit, and catalog:classify permissions. The backend RBACService role hierarchy places STEWARD (level 40) below ANALYST (level 50), so steward-specific backend authority comes from explicit @PreAuthorize lists on controllers rather than the role hierarchy.
Module layout
The Hub mounts at /governance (entry src/pages/GovernanceHub.tsx, layout src/layouts/GovernanceHubLayout.tsx). A nested sidebar lists the governance sub-sections; a horizontal GovernanceSubNav tab bar sits at the top of every screen for quick switching.
+------------------------------------------------------------------+
| Top Bar   [Logo] DataFlow AI   [Search]   [Bell] [T. Avatar]      |
+------------------------------------------------------------------+
| Sidebar (240px)            | Main content area                   |
|  > Dashboard               | +-------------------------------+   |
|  > Design Studio           | | GovernanceSubNav tabs         |   |
|  > Pipeline Monitor        | | [Lineage][Quality][Reviews]   |   |
|  v GOVERNANCE HUB (active) | | [Glossary][Audit Trail]       |   |
|    > Lineage Explorer      | +-------------------------------+   |
|    > Quality Monitoring    | |                               |   |
|    > Review Queue          | |   (Screen content renders)    |   |
|    > Business Glossary     | |                               |   |
|    > Audit Trail           | |                               |   |
|  > Admin Console           | +-------------------------------+   |
+----------------------------+-------------------------------------+
The five primary sub-sections — Lineage Explorer, Quality Monitoring, Review Queue, Business Glossary, Audit Trail — fan out into roughly fifteen governance sub-pages and panels (lineage graph, impact analysis modal, quality dashboard, domain breakdown, quality rules grid, AI insight panel, review queue list, review detail, governance score breakdown, glossary list, glossary term detail, audit trail, data product certification, DSAR/erasure workflow, PII classification view).
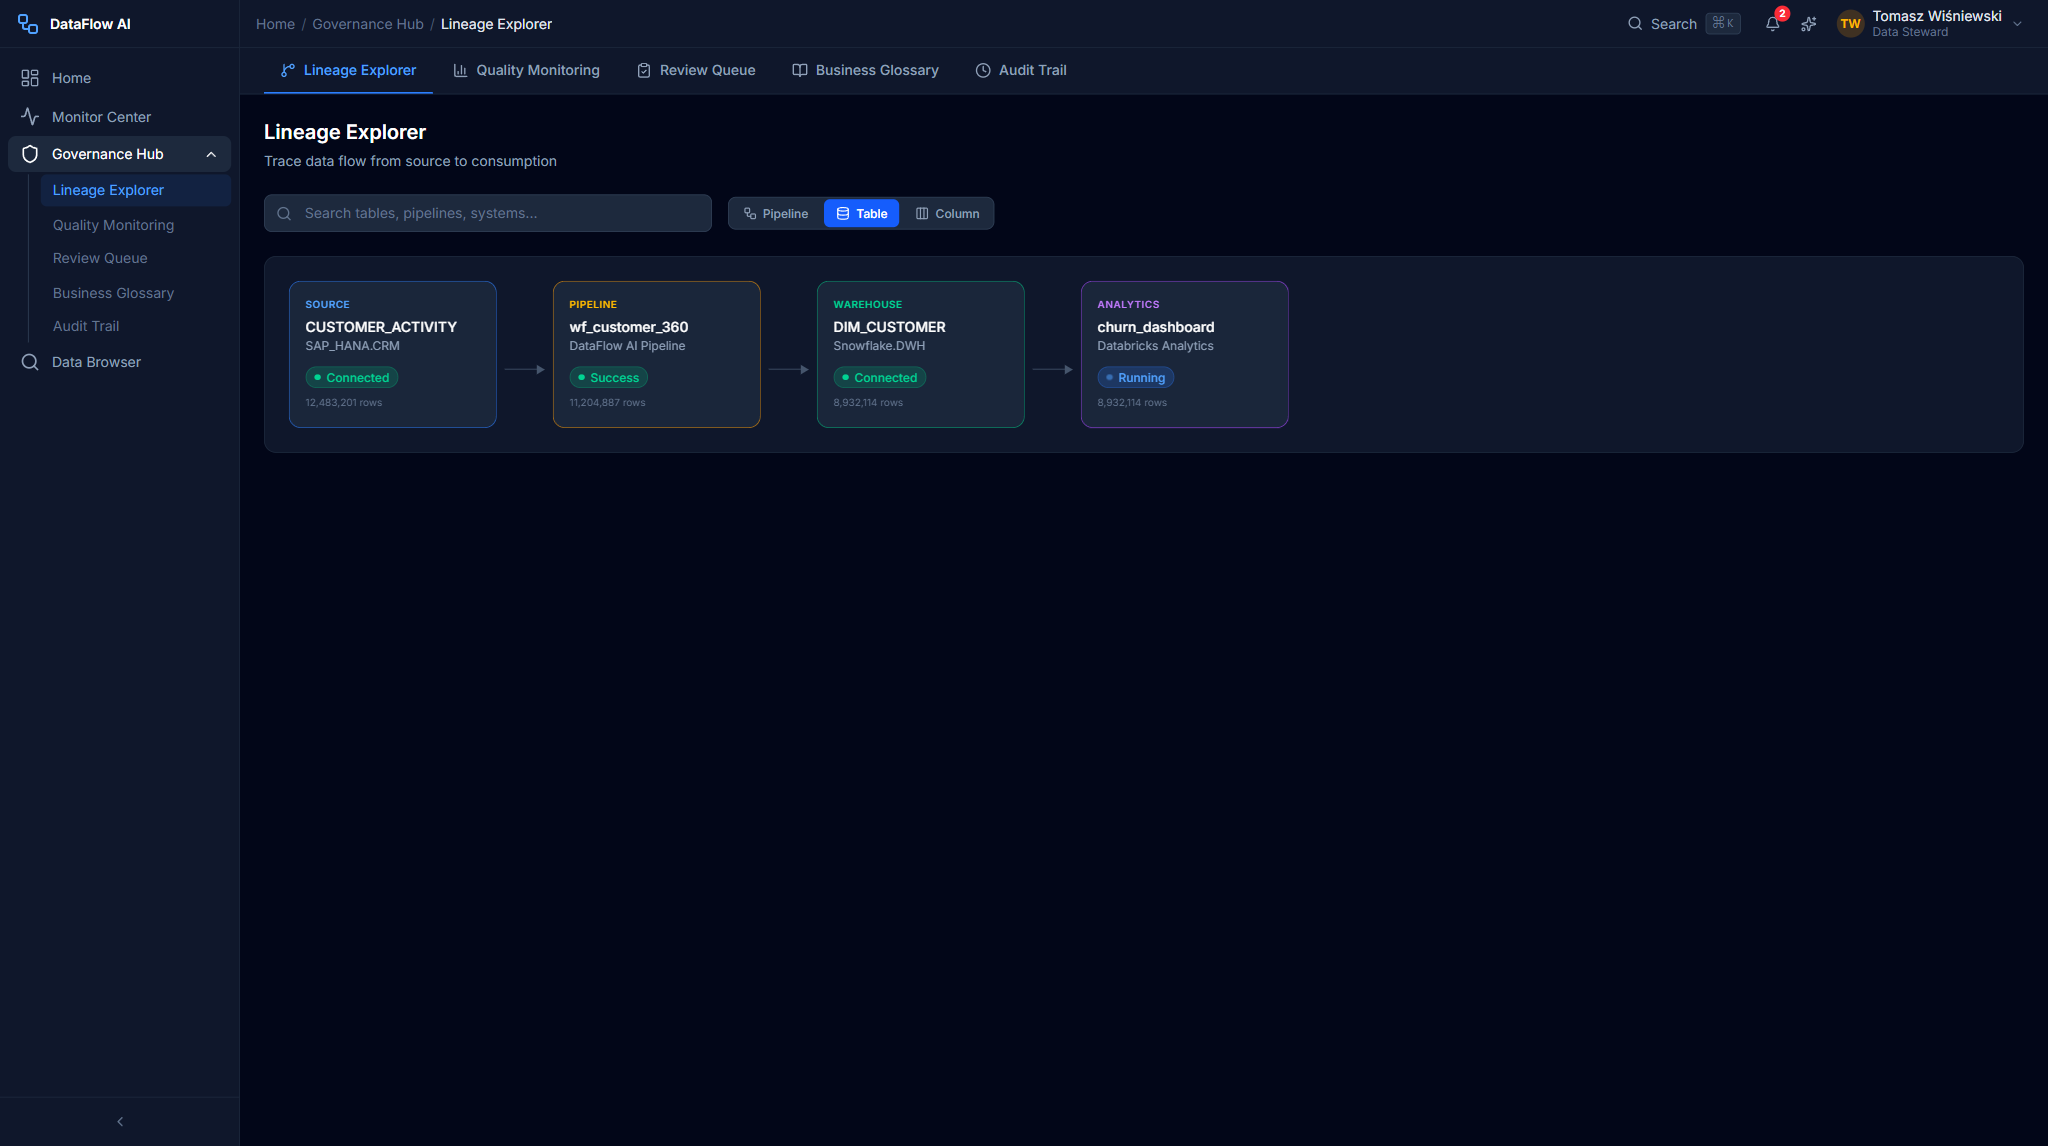
Data Lineage Explorer
Route: /governance/lineage — entry src/pages/governance/LineageExplorerPage.tsx.
The Lineage Explorer is an interactive D3.js graph of lineage across all Polkomtel systems. It answers two questions: where does this data come from? and what breaks if I change this column?
Screen layout
+------------------------------------------------------------------+
| Toolbar                                                           |
| [Search: "Search for any table, column, or pipeline..."]          |
| Lineage Level:  ( ) Pipeline   ( ) Table   (*) Column             |
| [Impact Analysis] [Expand All] [Reset View] [Export PNG]          |
+------------------------------------------------------------------+
| Main Graph Area (min-h 600px)                                     |
|                                                                   |
|  [SAP HANA]--->[wf_customer_360]--->[Snowflake]--->[Databricks]   |
|  (cylinder)     (rectangle)          (cylinder)     (database)    |
|                                                                   |
+------------------------------------------------------------------+
| Detail Panel (320px right slide-in, when a node is selected)      |
+------------------------------------------------------------------+
UI controls
| Control | Behavior |
|---|---|
| Search bar | Debounced 300ms typeahead; up to 8 suggestions grouped by type (table/column/pipeline/database); selecting one centers and highlights that node |
| Lineage Level toggle | Three radio buttons — Pipeline (4 large nodes), Table (tables per system), Column (full column-level dots); animated 300ms expand/collapse transition |
| Impact Analysis | Opens the impact modal for the selected node |
| Expand All | Expands every collapsed node group |
| Reset View | Re-centers and resets zoom |
| Export PNG | Renders the current graph to a PNG download |
Node shapes are type-coded: database = cylinder rectangle, pipeline = rounded rectangle, table = grid rectangle, column = dot (emerald normal / amber selected / red quality issue), transform = diamond. Edges are dashed slate by default; a traced lineage path turns solid indigo with a flowing dash animation. Pan via click-drag; zoom via mouse wheel (0.3x–3.0x). The graph uses a left-to-right dagre layout: SAP HANA on the left, the pipeline transforms center-left, Snowflake DWH center-right, and Databricks Analytics on the right, with 300px horizontal spacing between system groups.
Detail panel
Clicking a node opens a 320px right panel: node name and fully-qualified path, data type, owner, quality score with bar, last-updated time, tags (e.g. PII, ML-Generated, Sensitive), description, upstream/downstream counts, and three actions — Show Impact Analysis, View Quality Rules, Open in Glossary.
Impact Analysis modal
The Impact Analysis modal (640px, centered) groups every downstream dependency by severity — Critical, High, Medium, Low — each with the dependency name, system, type (table/column/pipeline/dashboard/report) and a description. A total dependency count and an Export Impact Report button sit at the bottom.
Click-path — trace a column's origin
- Open
/governance/lineage. - Set the Lineage Level toggle to Column.
- Type
CHURN_SCOREinto the search bar and pick the SnowflakeDWH.DIM_CUSTOMER.CHURN_SCOREsuggestion. - The graph centers and highlights the full path: SAP HANA source columns (
ACTIVITY_DATE,ACTIVITY_TYPE,CALL_DURATION_SEC,MONTHLY_ARPU,PAYMENT_STATUS) → theML_SCORE_CALCPython UDF transform →CHURN_SCOREin Snowflake → onward to the Databrickschurn_dashboard, the SnowflakeRPT_CUSTOMER_HEALTHreport, andAGG_MONTHLY_CHURN. - Click the
CHURN_SCOREnode — the detail panel slides in. - Click Show Impact Analysis — the modal lists every downstream dependency grouped by severity.
Behind the scenes
api/lineage.ts serves the graph; the backend lineage-service exposes BiLineageController (read = ROLE_ADMIN or ROLE_STEWARD) and LineageAuthoringController (edit = STEWARD/ADMIN). Lineage propagation is admin-only.
Quality Monitoring Dashboard
Route: /governance/quality — entry src/pages/governance/QualityMonitoringPage.tsx.
A single-pane view of data quality across the CRM, Billing, Network, and CDR domains. It surfaces failing rules, trends, and AI-powered root-cause insights before the steward has to go looking.
Screen layout
+------------------------------------------------------------------+
| Quality Monitoring Dashboard      Last refreshed: 2 min ago       |
|                                            [Refresh] [Export]     |
+------------------------------------------------------------------+
| Row 1: Overall Score gauge        | AI Insight card               |
|        [ ===== 97.3% ===== ]      | "IMEI format changed in new   |
|        +0.2% vs last week         |  handset batch..." [View][x]  |
+------------------------------------------------------------------+
| Row 2: Domain cards                                               |
| [CRM 98.1%] [Billing 97.8%] [Network 96.2%] [CDR 94.1% ALERT]    |
+------------------------------------------------------------------+
| Row 3: Quality Trend chart (30-day multi-line per domain)         |
+------------------------------------------------------------------+
| Row 4: Quality Rules grid (search + domain/status filters)        |
+------------------------------------------------------------------+
UI components
| Component | What it shows |
|---|---|
| Overall Quality Score gauge | Recharts semicircle gauge; red 0–80, amber 80–95, emerald 95–100; week-over-week delta below |
| AI Insight card | Indigo-tinted card with lightbulb icon, root-cause message, affected rule/domain/record count, confidence %, View Details / Dismiss |
| Domain breakdown cards | One per domain — score, delta, total rules, failing rules; alerted domains get a red border and pulsing dot |
| Quality Trend chart | 30-day Recharts line chart, one line per domain; toggle pills to show/hide domains; Y-axis 90–100% to amplify differences |
| Quality Rules grid | Rule name, domain badge, pass rate with mini-bar, trend sparkline, last-check time, status dot; failing rules sort to the top |
Each rule row expands inline on click to reveal the rule description, failed/total record counts, and the AI insight if one is attached.
Click-path — review data quality
- Open
/governance/quality. - Scan the domain breakdown cards — the red-bordered CDR card (94.1%, 3 failing rules) is alerted.
- Click the CDR card — the rules grid filters to CDR rules.
- Click the
IMEI_FORMAT_CHECKrow to expand it. - Read the AI insight: the IMEI format changed in a new Xiaomi Redmi Note 15 handset batch; the suggested fix updates the regex from
^[0-9]{15}$to^[0-9]{2}-?[0-9]{13}$. - Optionally click the AI Insight card's View Details to jump straight to the affected rule.
Behind the scenes
api/quality.ts serves scores and rules. AI quality insights are generated by the Copilot service's quality-rule and insight prompts (NL → structured rules with confidence scores). Quality rule types include NOT_NULL, UNIQUE, RANGE, REGEX, ROW_COUNT, CUSTOM_SQL, FRESHNESS, COMPLETENESS, SCHEMA_MATCH, and STATISTICAL.
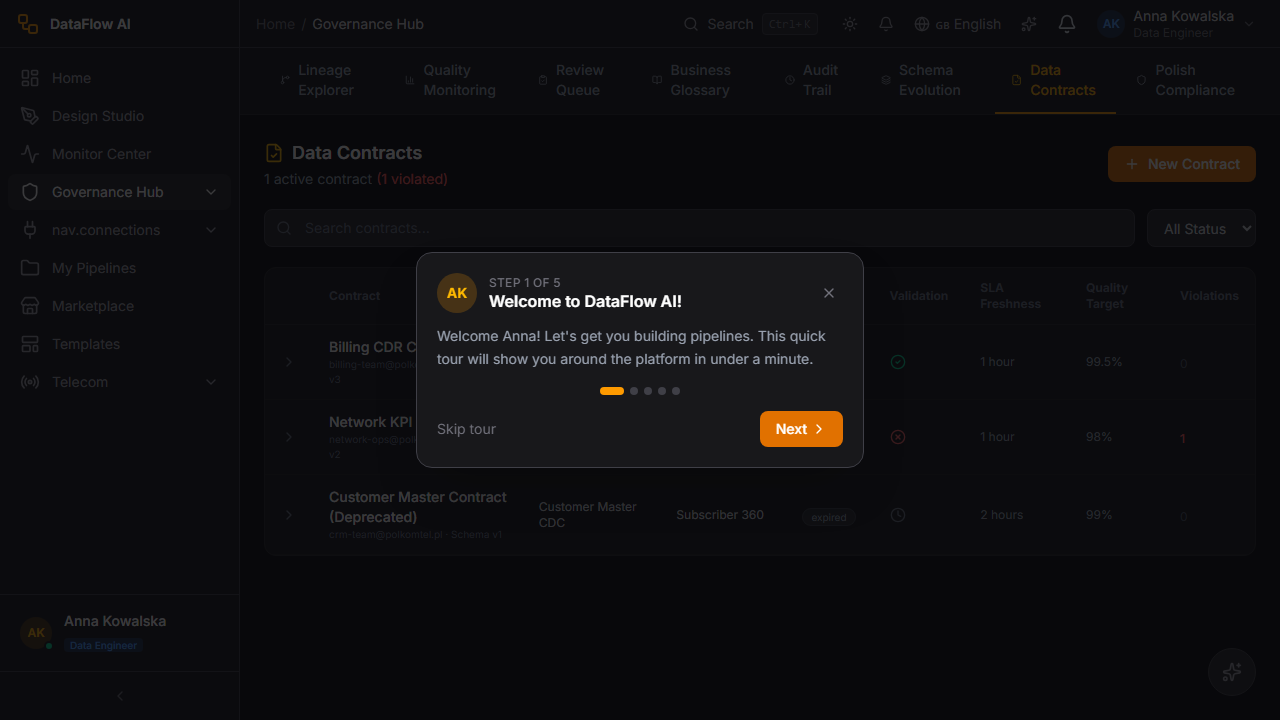
Data Contracts
A data contract is the agreed, versioned interface between a data producer and its consumers — it pins down the schema, semantic types, nullability, freshness expectations, and quality guarantees of a dataset so that a downstream pipeline can depend on it without surprise breakage. The Governance Hub's Data Contracts view lists every registered contract, its owning team, its consumers, and its current compliance state.
What a contract pins down
| Clause | What it enforces |
|---|---|
| Schema | The exact column set, ordering, and data types of the dataset |
| Semantic type | Domain meaning per column (MSISDN, PESEL, ARPU) so consumers read it correctly |
| Nullability | Which columns are guaranteed non-null |
| Freshness SLA | The maximum age of the data before it is considered stale |
| Quality guarantees | The quality rules that must pass for the contract to be honored |
| Versioning | A semantic version; breaking schema changes require a major bump |
A contract is violated when a pipeline run produces output that no longer satisfies a clause — for example a column is dropped, a type widens, or the freshness SLA is missed. Violations surface as alerts to both the producer and the registered consumers, and a breaking change is blocked from production until the contract is re-versioned and consumers acknowledge it.
Contracts and the review queue
A pipeline whose output backs a registered data contract is checked against that contract during governance review. If the generated schema diverges from the contract, the review's lineage-completeness and schema checks flag it before the steward can approve deployment.
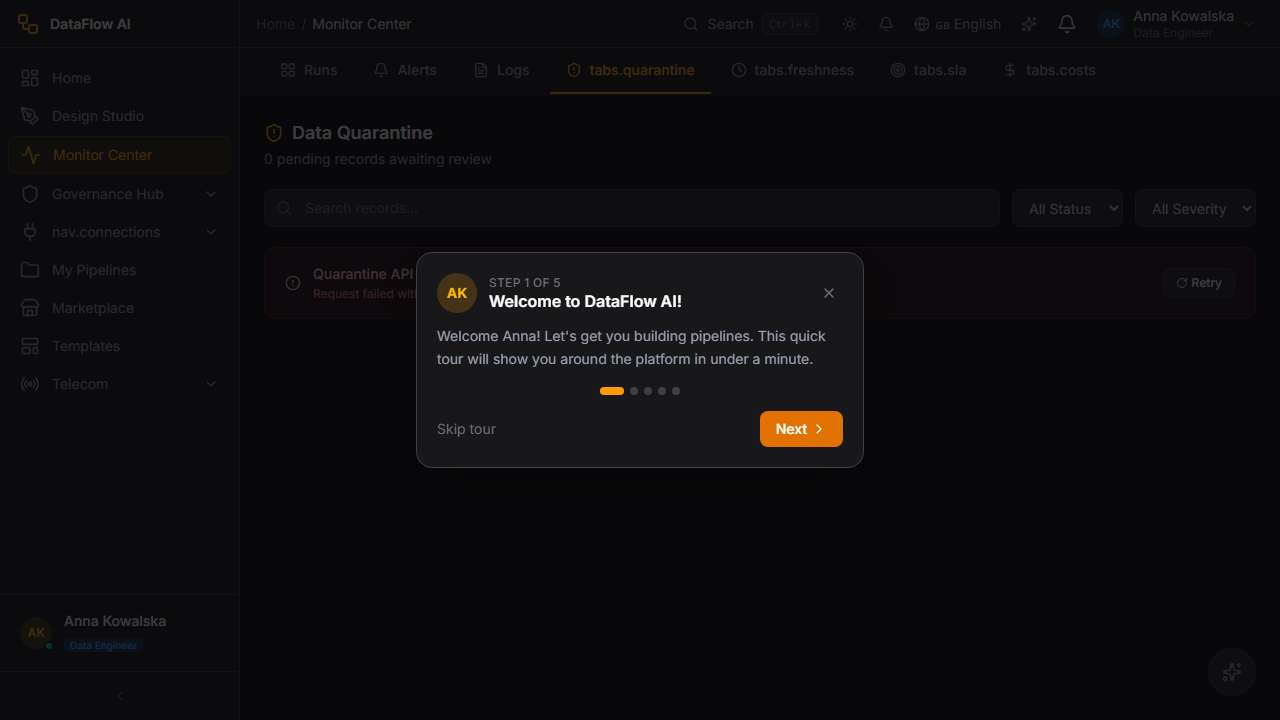
Data Quarantine
When a pipeline run produces records that fail a blocking quality rule, those records are not silently dropped and not loaded into the target — they are routed to the data quarantine, a holding area where suspect rows wait for a steward decision. Quarantine keeps bad data out of production while preserving it for inspection, so an ingestion problem never corrupts a downstream table and never loses evidence.
How quarantine works
| Step | What happens |
|---|---|
| 1. Detect | A blocking quality rule fails during a pipeline run — e.g. IMEI_FORMAT_CHECK rejects malformed IMEIs |
| 2. Route | The failing records are diverted to the quarantine store instead of the target table |
| 3. Hold | The quarantined batch is listed with its source pipeline, failing rule, record count, and timestamp |
| 4. Inspect | A steward opens the batch, reviews sample failing rows, and reads any attached AI insight |
| 5. Resolve | The steward either releases the batch (reprocess once the rule or data is fixed) or rejects it (discard the bad records) |
The pipeline-engine QuarantineController backs this surface — read access is granted to ADMIN, STEWARD, and ENGINEER, while release is restricted to ADMIN. Every release and rejection is written to the governance audit trail.
Click-path — clear a quarantined batch
- Open the Governance Hub and navigate to the Data Quarantine view.
- Locate the held batch — each row shows the source pipeline, the failing rule, the record count, and how long it has been held.
- Open the batch to inspect sample failing rows and the diff against the expected schema or rule.
- Fix the root cause — update the failing quality rule (e.g. widen a regex) or correct the upstream data.
- Release the batch to reprocess the records, or Reject it to discard them permanently.
- The action is recorded in the audit trail with the actor, batch ID, and outcome.
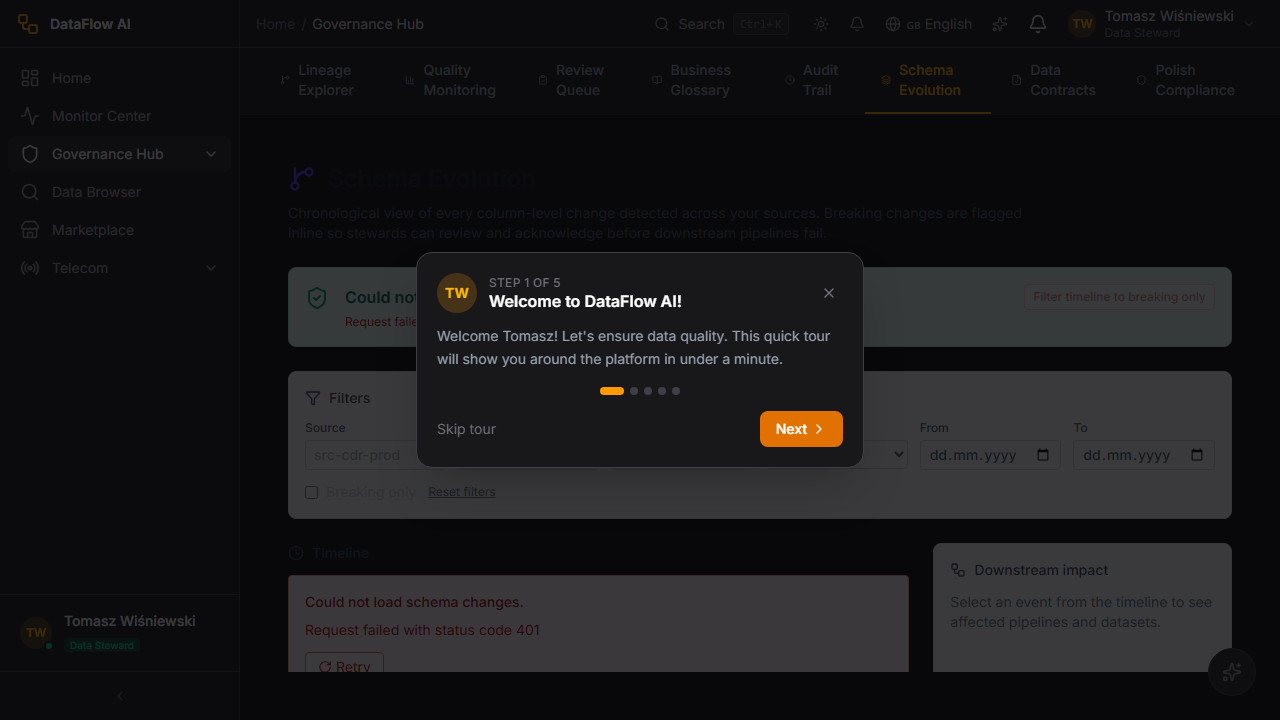
Schema Evolution
Source systems change — a column is added to a SAP HANA table, a type widens in Snowflake, a field is renamed. The Governance Hub's Schema Evolution view tracks every detected schema change across the connected estate, classifies it by severity, and shows which pipelines and contracts it affects, so a change is reviewed before it silently breaks a downstream pipeline.
Change classification
| Change type | Severity | Typical handling |
|---|---|---|
| Column added | Low | Additive — usually safe; pipelines ignore the new column unless explicitly mapped |
| Column type widened | Medium | Compatible — review for precision or rounding impact |
| Column nullability relaxed | Medium | Review — downstream non-null assumptions may break |
| Column renamed | High | Breaking — any pipeline referencing the old name fails |
| Column dropped | High | Breaking — downstream selects and joins fail |
| Type narrowed / incompatible | High | Breaking — data truncation or load failure |
Each tracked change records the system, table, column, the before/after definition, the detection time, and the list of affected pipelines and data contracts. High-severity (breaking) changes raise an alert and, where the affected dataset backs a data contract, block the contract from advancing until it is re-versioned.
The connector framework's schema-evolution capability (declared per connector in the connector-sdk) is what makes detection possible — connectors that support it report schema deltas on each run, which the metadata-service records and the Schema Evolution view renders as a timeline.
Note
Quality rule generation is grounded in Polkomtel domain knowledge — PESEL is validated as ^\d{11}$, MSISDN as ^48\d{9}$, and revenue/ARPU rules enforce non-negative values.
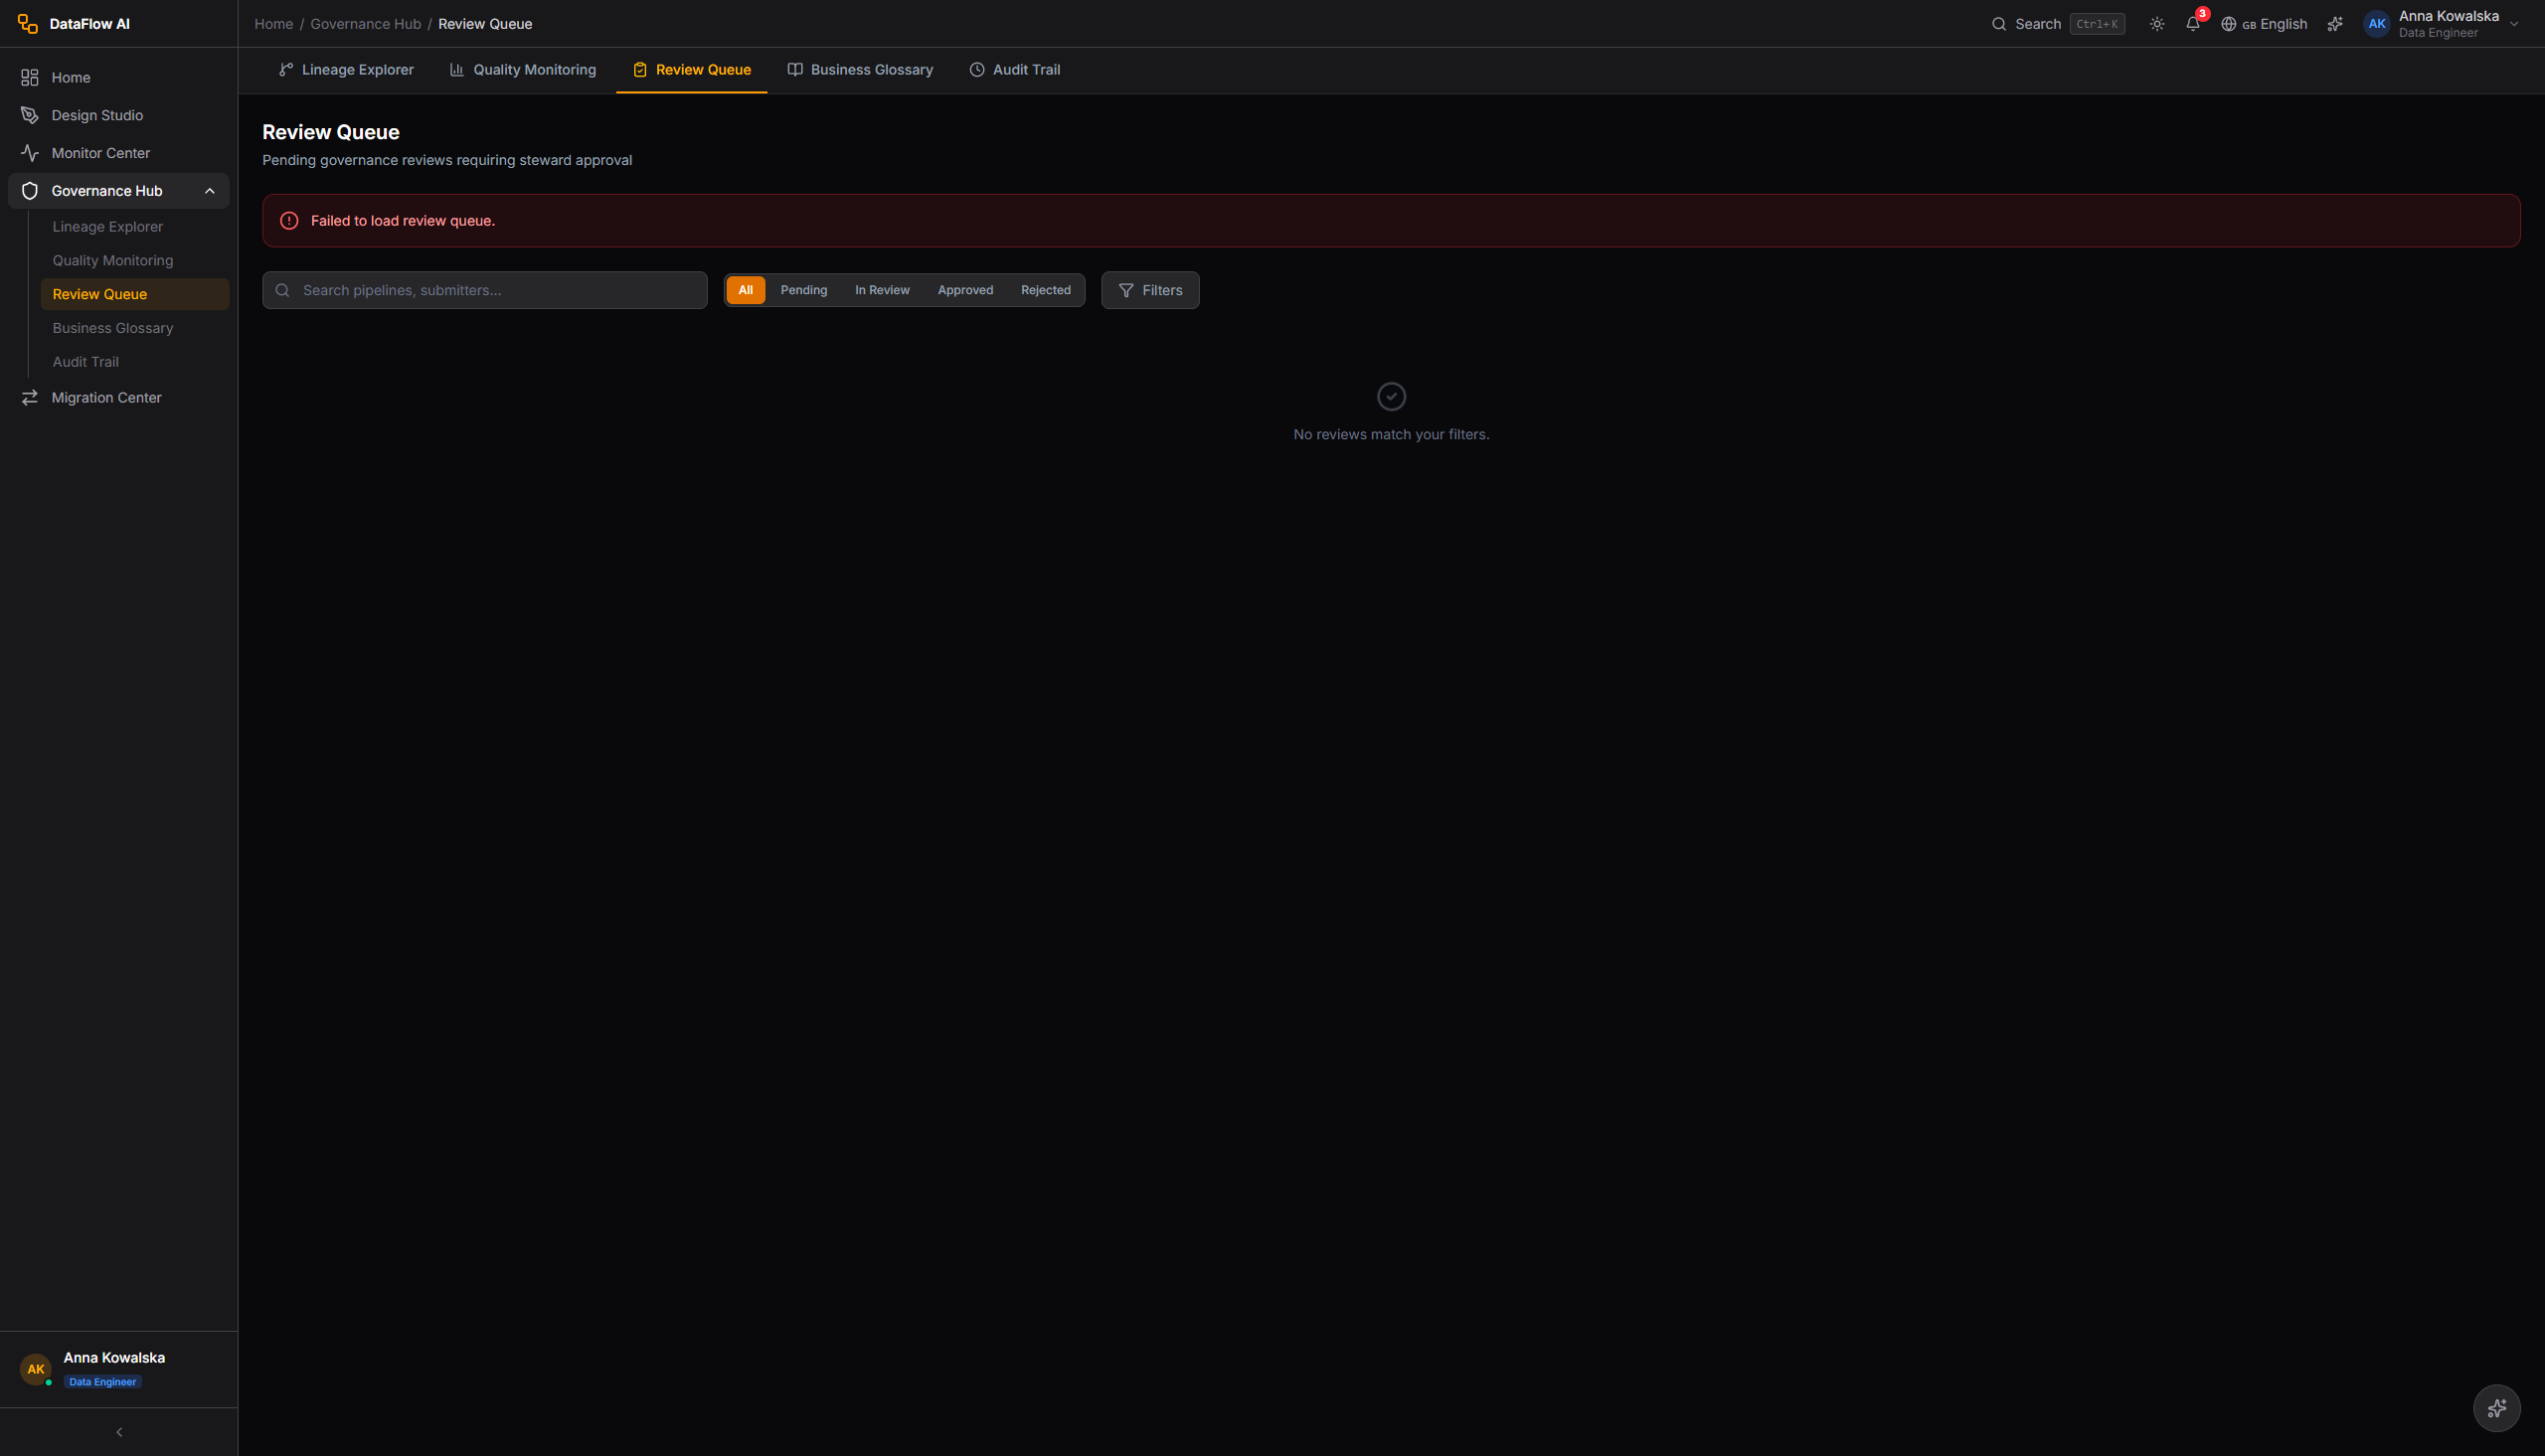
Governance Review Queue
Route: /governance/reviews — entry src/pages/governance/GovernanceReviewPage.tsx.
The Review Queue lists every pipeline awaiting governance approval before it can be deployed to staging or production. Each review carries an automated governance score out of 100, computed from PII tagging, masking coverage, retention policy, lineage completeness, and quality-rule coverage.
Screen layout
+------------------------------------------------------------------+
| Governance Review Queue            [Filter v] [Sort v]            |
| 4 pipelines awaiting review                                       |
+------------------------------------------------------------------+
| [PENDING] wf_Subscriber_Churn_v2 | Anna K.  | 94/100 | 7 pass 1 warn|
|   Submitted 2 hours ago | depends on wf_customer_360             |
+------------------------------------------------------------------+
| [PENDING] wf_CDR_Daily_Agg       | Piotr M. | 88/100 | 6 pass 2 warn|
|   Submitted 5 hours ago | CDR domain, batch processing           |
+------------------------------------------------------------------+
Review detail
Opening a review shows the full automated governance scorecard — each check (PII tagging, masking, retention, lineage completeness, quality rules) marked pass or warn — alongside the pipeline metadata, requester, and dependency list. The steward then Approves or Rejects the review.
Click-path — approve a pipeline
- Open
/governance/reviews. - Click a row with a
PENDINGstatus badge. - Inspect the governance score and the per-check pass/warn breakdown.
- Confirm masking and PII checks are satisfactory.
- Click Approve (or Reject with a reason) — the pipeline becomes eligible for staging/production deployment.
Behind the scenes
api/governance.ts serves the review queue and detail. The backend governance/reviews/** endpoints are public matchers at the service layer; approval mutations are guarded by steward/admin authorization. Approved reviews unlock the Deploy split-button in Design Studio.
Data product certification
Data products are catalog assets — curated, governed tables and views — that a steward can formally certify so consumers know the asset is trustworthy. Certification adds an endorsement badge visible in the Data Browser catalog.
Click-path — certify a data product
- Open the Data Browser and navigate to the data product's Table Detail view (
/data-browser/table/{database}/{schema}/{table}). - Confirm the asset's quality score, lineage completeness, and PII classification in the relevant tabs.
- Open the asset's governance panel and choose Certify.
- Select the certification tier and add a justification note.
- Confirm — the asset now shows a
Certifiedendorsement badge in the catalog Tag Cloud and search results.
Behind the scenes
api/endorsements.ts records the certification; api/dataProducts.ts and api/catalog.ts surface the badge. Catalog asset descriptions can be auto-drafted by the Copilot /describe/asset endpoint. Certification and classification require catalog:edit / catalog:classify permissions (steward or admin).
GDPR & DSAR workflows
The Governance Hub hosts Polkomtel's GDPR compliance workflows — Data Subject Access Requests (DSAR) and the right-to-erasure process. Erasure is a destructive, audited operation: the steward identifies the subject, the platform locates every record across systems, and a coordinated erasure runs with full audit capture.
PII masking
Personally identifiable information is masked at two layers:
- Gateway response masking — the API Gateway's
PiiMaskingFilterscrubs PII from error responses (HTTP 4xx/5xx). It recognizes EMAIL, Polish phone numbers, PESEL, credit cards, IBAN, IP addresses, and Polish postal codes. Successful 2xx payloads pass through unmasked by design — versioned DTOs are expected to carry no free-form PII. - Catalog PII classification — the metadata-service
PiiClassifierControllerscans and tags catalog columns. Scanning is open toADMIN/ANALYST/STEWARD/ENGINEER; applying a classification is restricted toADMIN/STEWARD.
Heads up
Right-to-erasure is irreversible. Once an erasure job completes, the affected subject records are removed from the targeted systems and cannot be recovered. Always confirm the subject identifier and the system scope before executing.
Click-path — run a DSAR erasure
- Open the Governance Hub and navigate to the GDPR / DSAR workflow.
- Create a new DSAR of type Erasure and enter the data subject identifier (e.g. MSISDN or PESEL).
- The platform discovers every record matching the subject across the connected systems and shows the affected-record scope.
- Review the discovered scope — confirm it matches the legal request.
- Submit the erasure for execution. The pipeline-engine
ErasureController(guardedhasAnyRole('ADMIN','STEWARD')) runs the coordinated erasure. - Track the job to completion; the result and every record touched are written to the governance audit trail.
Behind the scenes
api/gdpr.ts drives DSAR creation, scope discovery, and erasure tracking. Overdue DSARs surface as alerts on the Data Steward's home dashboard. The pipeline-engine also exposes a QuarantineController for holding suspect records (read = ADMIN/STEWARD/ENGINEER, release = ADMIN).
Business Glossary
Route: /governance/glossary.
The Business Glossary is the catalog of Polkomtel telecom terminology — metrics, dimensions, and filters with agreed definitions. It mirrors the semantic layer the Copilot uses to enrich natural-language SQL.
The built-in glossary includes roughly eleven metrics (churn rate, ARPU, MoU, data usage, net adds, revenue, blended ARPU, and more — each with a SQL formula and source tables), about fourteen dimensions (region, city, tariff plan, segment, channel, date parts, device type, network type), and seven filter templates (active subscribers, last N days, postpaid, prepaid, B2B). Stewards can register custom terms at runtime.
Each glossary entry links back to the assets that use it, and the lineage detail panel's Open in Glossary action jumps straight to the matching term.
Audit Trail
Route: /governance/audit.
The Audit Trail is the immutable log of governance activity — certifications, review approvals/rejections, erasure runs, classification changes, and lineage edits.
Audit entries are produced by the gateway's AuditInterceptor, which intercepts every POST/PUT/PATCH/DELETE on /api/** and dual-writes: a structured JSON line via the com.polkomtel.dataflow.audit SLF4J logger for SIEM ingestion, and an asynchronous database row. Each entry captures the event ID, request ID, action, method, path, resource type and ID, status code, duration, actor identity (user ID, email, role, workspace from the gateway-injected X-User-* headers), remote address, and success/error detail.
| Field | Captured value |
|---|---|
| Action | CREATE / UPDATE / PARTIAL_UPDATE / DELETE |
| Actor | userId, email, role, workspaceId |
| Resource | type + id |
| Outcome | statusCode, success flag, durationMs |
| Severity by status | 2xx → INFO, 4xx → WARN, otherwise ERROR |
Audit logs are retained 365 days and exportable to SIEM. Read access to the audit log is restricted to ROLE_ADMIN.
Governance sub-page map
| Sub-page / panel | Route or surface |
|---|---|
| Lineage Explorer | /governance/lineage |
| Impact Analysis modal | modal on Lineage Explorer |
| Lineage detail panel | slide-in on Lineage Explorer |
| Quality Monitoring Dashboard | /governance/quality |
| Domain breakdown cards | section on Quality dashboard |
| Quality Rules grid | section on Quality dashboard |
| AI Quality Insight panel | section on Quality dashboard |
| Governance Review Queue | /governance/reviews |
| Review detail / scorecard | drill-in on Review Queue |
| Business Glossary | /governance/glossary |
| Glossary term detail | drill-in on Glossary |
| Audit Trail | /governance/audit |
| Data product certification | governance panel in Data Browser |
| GDPR / DSAR & erasure workflow | Governance Hub GDPR surface |
| PII classification view | metadata-service PII classifier |
| Data Contracts | Governance Hub contracts surface |
| Data Quarantine | Governance Hub quarantine surface |
| Schema Evolution | Governance Hub schema-change surface |
Walkthrough — a Data Steward's daily routine
Here is the round a steward makes each morning to keep Polkomtel's data healthy and compliant. It usually takes ten to fifteen minutes.
- Open the Governance Hub. Click Governance in the sidebar (or press
Alt+G). The Quality Monitoring dashboard is a good starting point. - Check the overall quality score. Read the big semicircle gauge. Emerald (95–100%) is healthy; amber or red needs investigation. Glance at the week-over-week delta underneath — a sudden drop is a signal.
- Spot the weak domain. Scan the four domain cards (CRM, Billing, Network, CDR). Any card with a red border and a pulsing dot is alerting. Click it to filter the rules grid to that domain.
- Investigate a failing rule. In the filtered rules grid, click the failing rule to expand it. Read the AI insight — it explains in plain words why the rule started failing and often suggests the exact fix (for example, a corrected regex pattern).
- Clear the quarantine. Open the Data Quarantine view. Any batch listed there is suspect data being held back from production. Inspect the sample rows, fix the root cause (correct the rule or the upstream data), then Release the batch to reprocess it or Reject it to discard the bad rows.
- Work the review queue. Open the Review Queue. Each pending pipeline shows a governance score out of 100. Open one, read the per-check pass/warn breakdown, confirm PII tagging and masking look right, then Approve it (or Reject with a reason).
- Handle privacy requests. If a DSAR (privacy request) is waiting, open it, review the discovered scope, and process it — see the erasure click-path above. Aim to resolve DSARs well inside the legal deadline.
- Glance at the audit trail. A quick look at the Audit Trail confirms nothing unexpected happened overnight.
The governance score, explained
Every pipeline awaiting review gets an automatic governance score out of 100. It is a weighted blend of: are PII columns tagged, is sensitive data masked, is a retention policy set, is lineage complete, and are quality rules attached. A score below the workspace threshold (commonly 90) means the pipeline is missing a safeguard — fix the flagged checks before approving.
Common questions
What is the difference between lineage and a data contract? Lineage describes what data actually does — its real journey through transformations, discovered by the platform. A data contract is a promise about a dataset — the schema, types, and freshness a producer guarantees to its consumers. Lineage is observation; a contract is an agreement.
What happens to rows that fail a quality rule? If the rule is a blocking rule, the failing rows are not loaded into the target and not silently dropped — they are routed to the Data Quarantine, a holding area, where a steward can inspect them and decide to release or reject them. This keeps bad data out of production without losing the evidence.
Why was a pipeline blocked from deploying? A pipeline must pass governance review before it reaches staging or production. If its governance score is below the threshold — usually because PII is untagged, masking is missing, or a retention policy is not set — the Deploy button stays locked until a steward approves it.
Is a DSAR erasure reversible? No. Right-to-erasure permanently removes the subject's records from the targeted systems. Always confirm the subject identifier (MSISDN or PESEL) and the system scope before you execute it.
Who can do what in the Governance Hub? Stewards and admins can approve reviews, certify data products, classify PII, and run erasures. Engineers can view lineage and quality. Analysts get a read-only view of quality and lineage. The audit trail itself is readable only by admins.
What is PII masking and when does it apply? Masking hides sensitive values (a phone number shown as 48*****1234). The platform masks PII in error responses automatically, and the catalog tags which columns are PII. Whether a given user sees real or masked values depends on their role.
A schema change broke a pipeline — could I have caught it earlier? Yes. The Schema Evolution view tracks every detected change to source tables and classifies it by severity. High-severity changes (a column renamed or dropped) raise an alert and, where the dataset backs a data contract, block it until the contract is re-versioned. Reviewing that view regularly catches breaking changes before they hit a run.
API reference
| Concern | API module |
|---|---|
| Lineage graph & impact | api/lineage.ts |
| Review queue & approvals | api/governance.ts |
| Quality scores & rules | api/quality.ts |
| Governance audit log | api/auditLog.ts |
| PII classification | api/pii.ts |
| Tags & domains | api/tags.ts, api/domains.ts |
| Policy & compliance frameworks | api/policy.ts, api/complianceFrameworks.ts |
| GDPR / DSAR / erasure | api/gdpr.ts |
| Certification / endorsements | api/endorsements.ts |
| Quarantine batches & release | pipeline-engine QuarantineController |
| Schema-change tracking | metadata-service monitor_* schema-change tables |
All requests flow through the API Gateway, which validates the Keycloak JWT (RS256 signature, issuer, and aud containing dataflow-api) and injects identity headers before forwarding to the governance-related services.